Telemetry is a concept extremely important with Dynamics 365 Business Central, especially in the cloud world. Every partner should have an internal policy in place for connecting customer’s tenants to Application Insights service and then monitoring the status of these tenants and their performances by periodically checking the telemetry data injected into the Application Insights service.
To start sending the telemetry data of your Dynamics 365 Business Central tenant to Azure Application Insights, you need to create an instance of this service in your Azure subscription (or customer’s subscription if you’re working as a partner). In this article, I present to you the main steps of how you can send telemetry data.
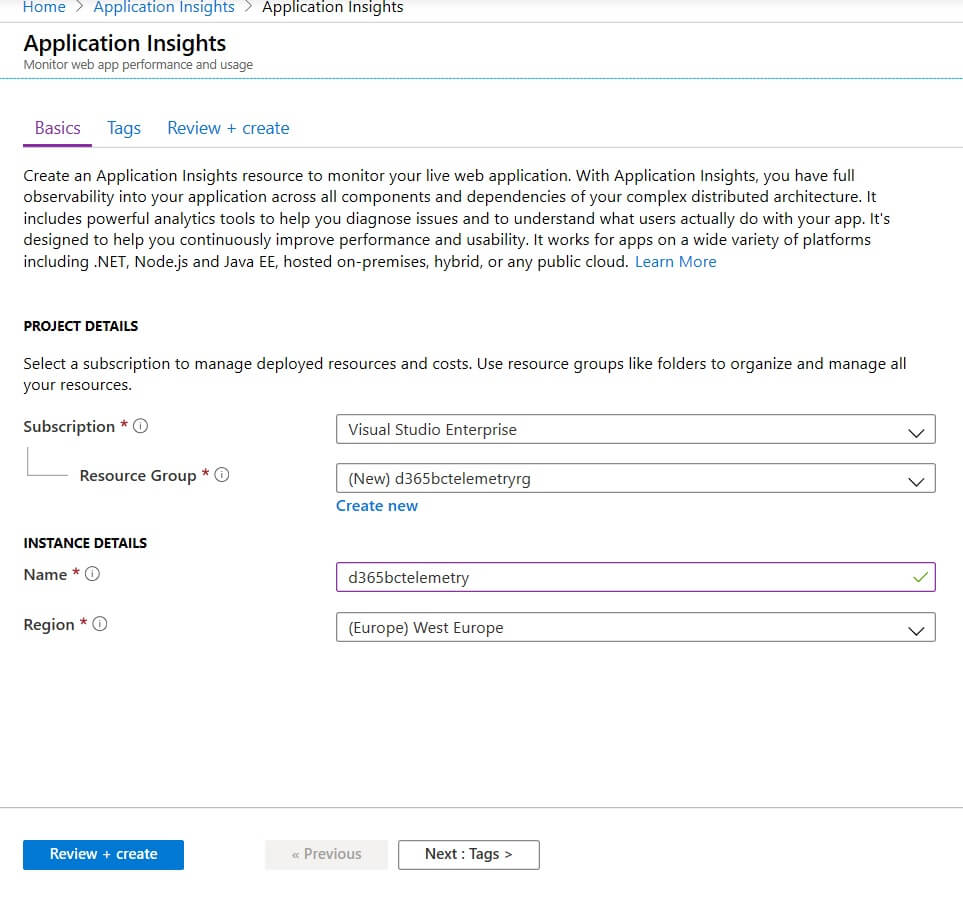
First step: go to the Azure Portal and create a new Application Insights instance
Second step: connect instrumentation key to Dynamics 365
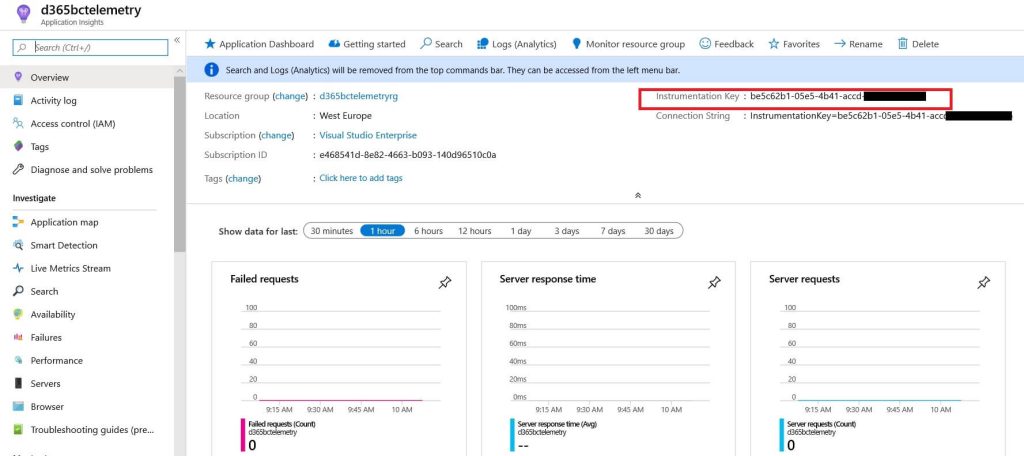
When the Application Insights instance is provisioned, you have an Instrumentation Key that must be used to connect Dynamics 365 Business Central:
Third step: insert the relative Instrumentation Key
To enable your Dynamics 365 Business Central tenant to send telemetry data to Application Insights you need to go to the Tenant Admin portal, select your environment, and on the Application Insights key option you can insert the relative Instrumentation Key.
Be aware that when you save the configuration, the environment is restarted (do that on non-working hours) and after that, your tenant is ready to send telemetry data to your Azure Application Insights instance.
When Dynamics 365 Business Central sends telemetry to your Application Insights instance, you should start analyzing all these data. To analyze the telemetry data, you’ve essentially the following ways:
- Using the Logs Analytics in Azure Portal,
- Using Jupyter Notebooks with Azure Data Studio,
- Using Powershell.
Logs Analytics
Logs Analytics (from the Azure Portal) is absolutely my preferred way of analyzing telemetry logs. You can write complex queries in KQL and execute them directly from the Azure Portal and you can perform in-depth analysis. There are only two main steps that have to be completed:
- The tool is powerful, but it requires knowledge of KQL and Azure stuff.
- It requires access to the Azure subscription.
Jupyter Notebooks
Sometimes executing KQL statements one by one in the Azure Application Insights portal can be tedious and this is where Azure Data Studio (the cross-platform database management tool) and Jupyter Notebooks + Kqlmagic (a command that extends the capabilities of the Python kernel in Azure Data Studio notebooks) could be a good solution.
Documentation on how to use Jupyter Notebooks with Azure Data Studio and KqlMagic for analyzing Business Central telemetry is available here.
Powershell
You can use Powershell scripts for reading telemetry data of your tenant in a “programmatic” way via the Application Insights REST APIs. A complete explanation on how to do that is available here.
As you can see, all these ways are not so suitable for a consultant. So one of the most requested questions is: is there a way to provide a graphical dashboard to my users for checking their tenant’s telemetry data without using too many technical tools?
YES: the answer is Power BI.
Analyzing telemetry data with Power BI
With Power BI, you can create a dashboard or reports that connect to your Azure Application Insights instance, and then you can analyze your telemetry data by creating dashboards and reports (that you can share with your users).
How to do that?
The first thing that you should do is to install Power BI Desktop into your system (download available from here).
Microsoft has released a set of pre-defined report templates (.pbit) that are a good starting point for telemetry analysis.
First step: Fill in the parameters
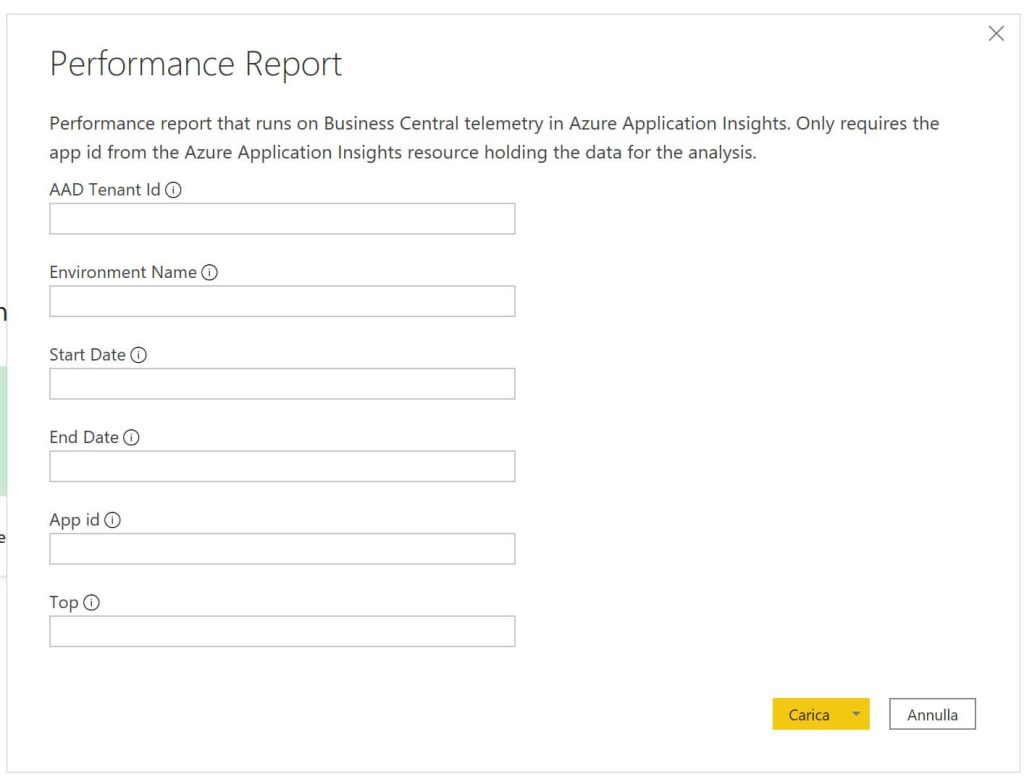
When loaded in Power BI Desktop, the report asks you for some parameters:
- AAD Tenant Id: ID of your Dynamics 365 Business Central tenant,
- Environment name: name of your Dynamics 365 Business Central where you want to analyze telemetry (environment connected to your Application Insights instance),
- Start Date and End Date: a range of dates (YYYY-MM-DD) for the telemetry data to analyze,
- App Id: Azure Application Insights App id, available by going to the API Access menu in the Azure Application Insights portal.
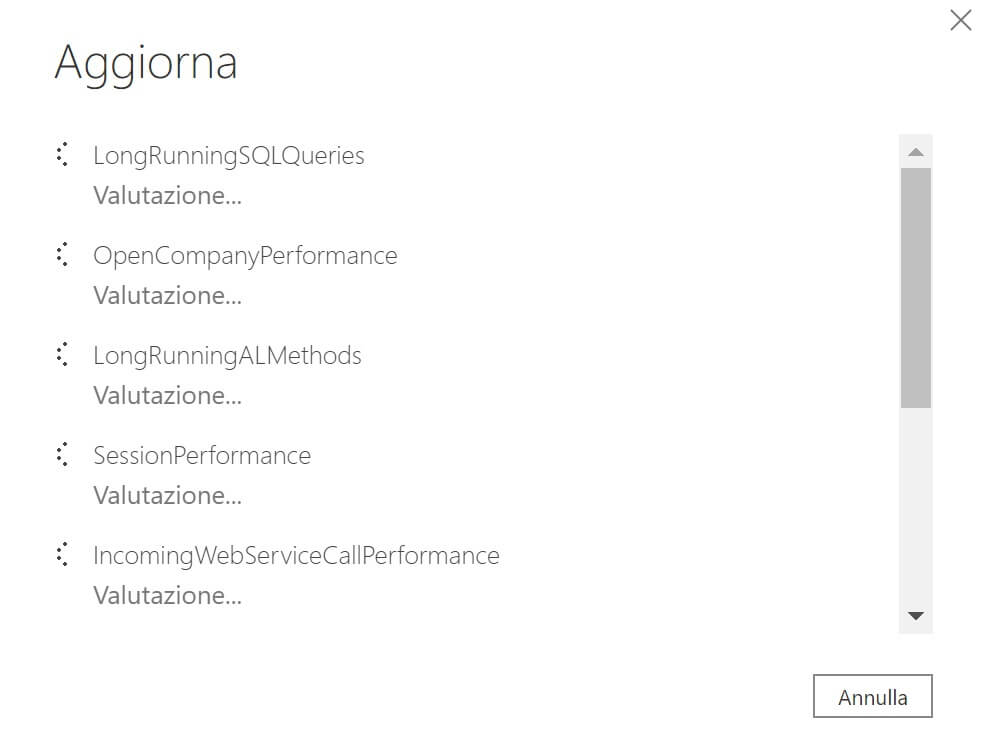
When the parameters are filled, click the Load button and a data refresh is performed:
Please be aware that to use Power BI with data from Application Insights, the user of the report must be in the same AAD tenant as the Application Insights resource and need to have read access to Application Insights resource. You can also create an API key on the Application Insights instance and then use Basic authentication with username and password set as equals to the API key.
Second step: analyze Power BI report
When data is refreshed, you can start checking your Power BI report. The report is divided into tabs and each tab pertains to a specific signal in the Dynamics 365 Business Central telemetry. Obviously, you have data into each tab only if your tenant has emitted the relevant signal (otherwise the report is empty).
- In the Sessions tab, you can monitor the distribution of your user’s sessions by also filtering for client type,
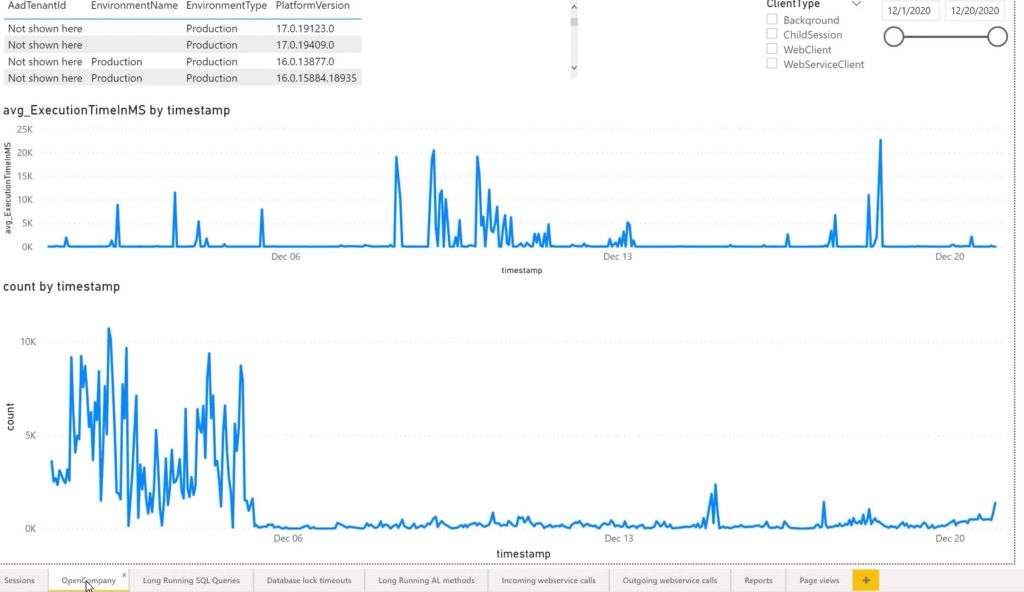
- OpenCompany tab you can monitor how the opening of a company performs (useful for checking if something is slow when accessing the system):
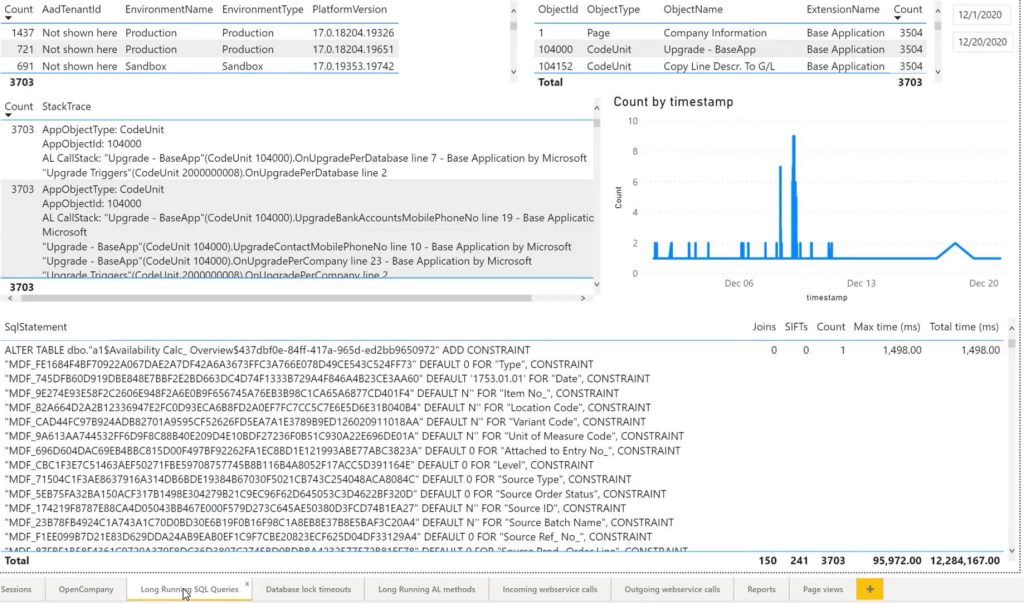
- In the Long-Running SQL Queries tab, you can monitor your long-running queries and see if there’s something on your code that can be optimized,
- In the Database lock timeouts tab, you can monitor your locks in the system (an object that causes the lock and user locking),
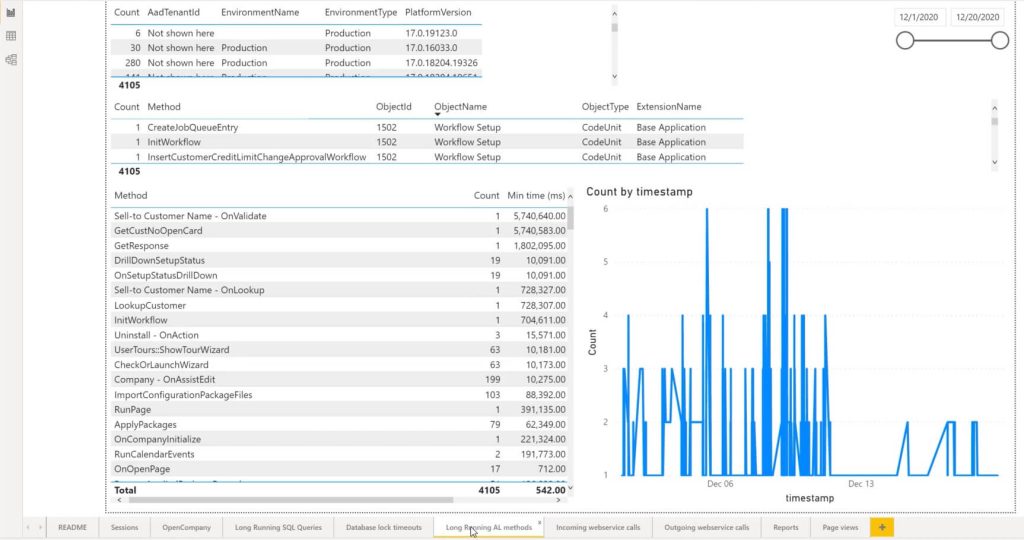
- The Long-Running AL methods tab helps you to see what methods in the AL code are slow and then you can investigate it:
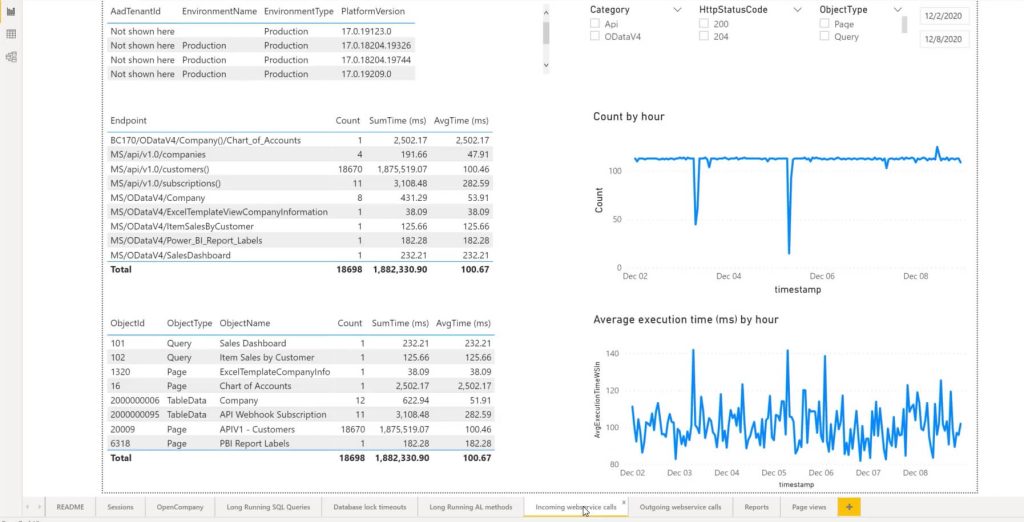
- In the Incoming web service calls tab you can deeper analyze the performances of your web service endpoints and filter by Category (API, OdataV4, SOAP), HttpStatusCode, and Object Type (Page, Query, etc.).:
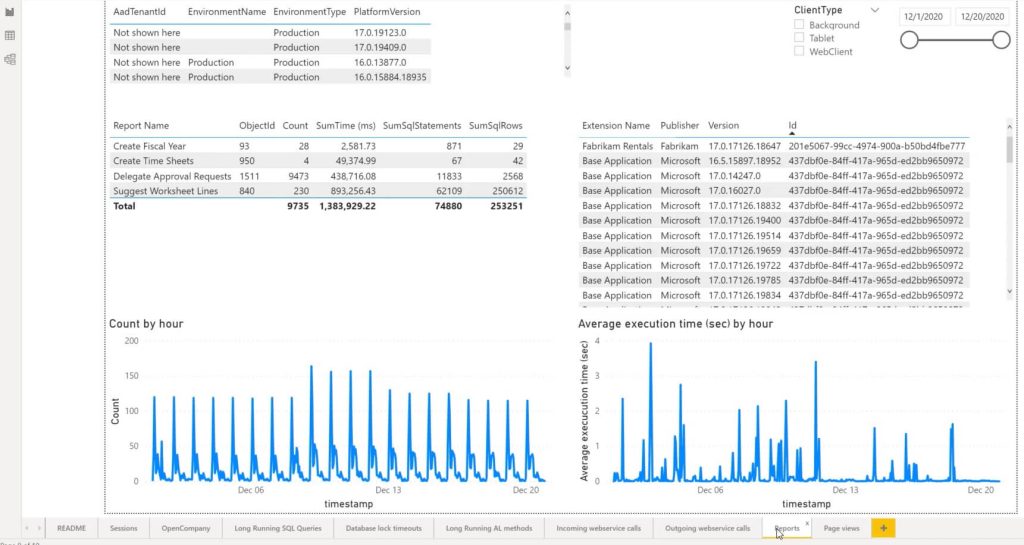
- In the Reports tab you can monitor the execution of your reports (how many times are executed, execution time, SQL statements, and more) and you can filter by client type (report executed from the UI or scheduled):
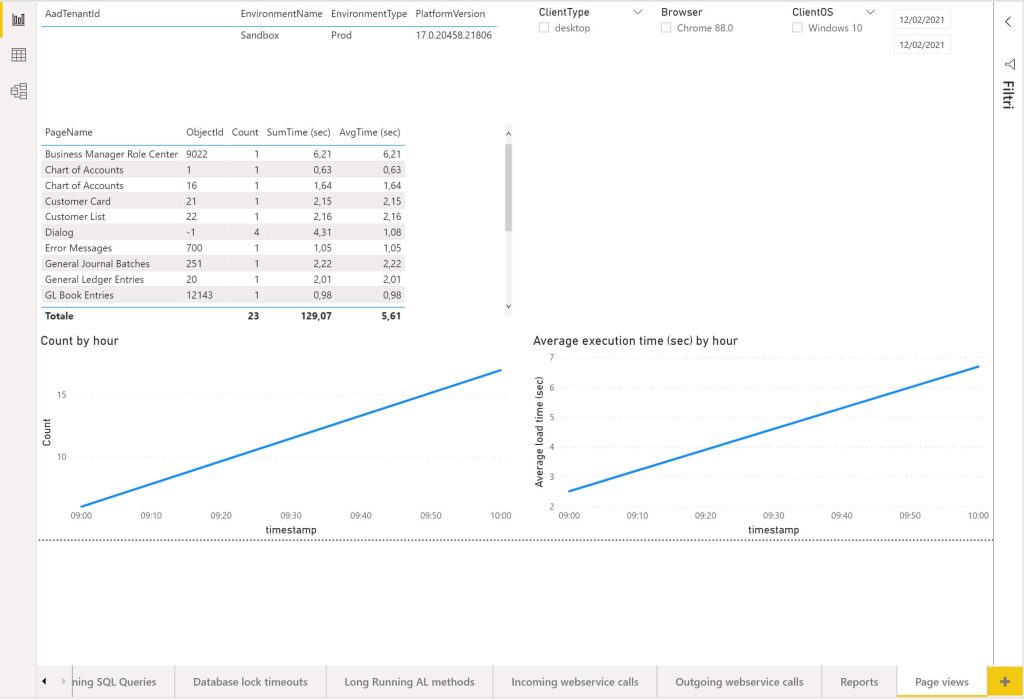
- In the Page Views tab, you can see an analysis of your page view (number of views per page, distribution on time, average execution time) and you can filter the analysis for client type, browser, OS, and more:
As you can see, you can completely monitor your tenant with a simple dashboard from your Power BI Desktop, without accessing the Azure Portal. You can apply custom filters, navigate the data from charts to details and do so on.
Another important tip to remember is that if you are a KQL developer or if a KQL developer has created for you an interesting Kusto query, you can reuse that query in Power BI by executing the following steps:
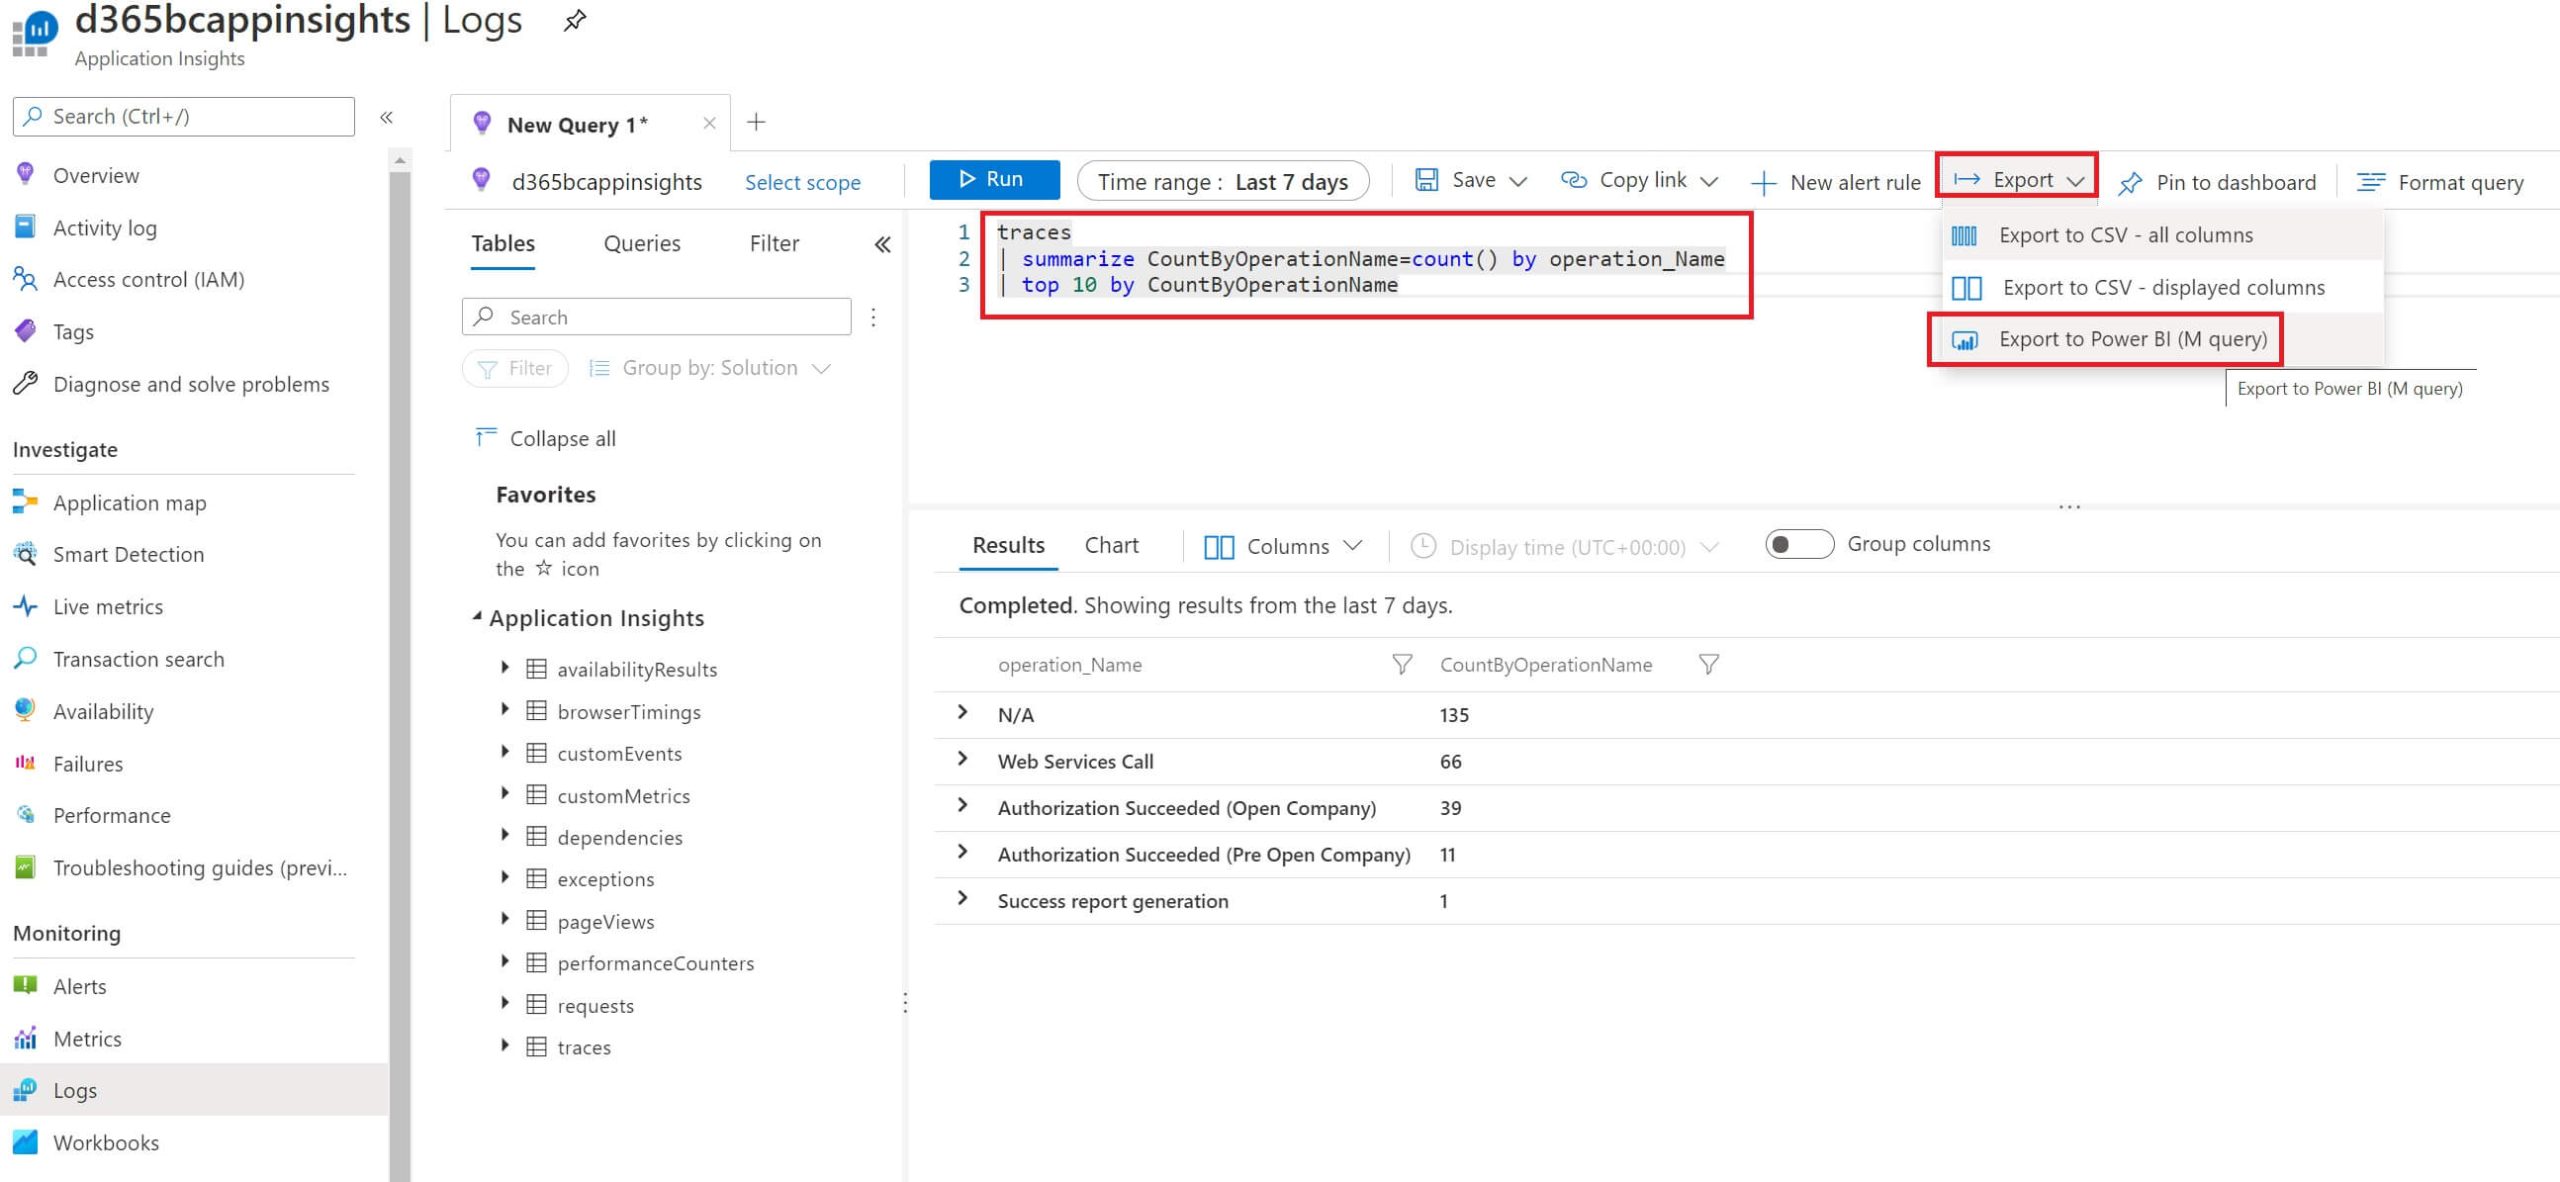
- Go to the Azure Portal, select your Application Insights instance, and then select Logs,
- Execute your KQL query on Log Analytics,
- When the results of the query are displayed, select Export and then click on Export to Power BI (M query):
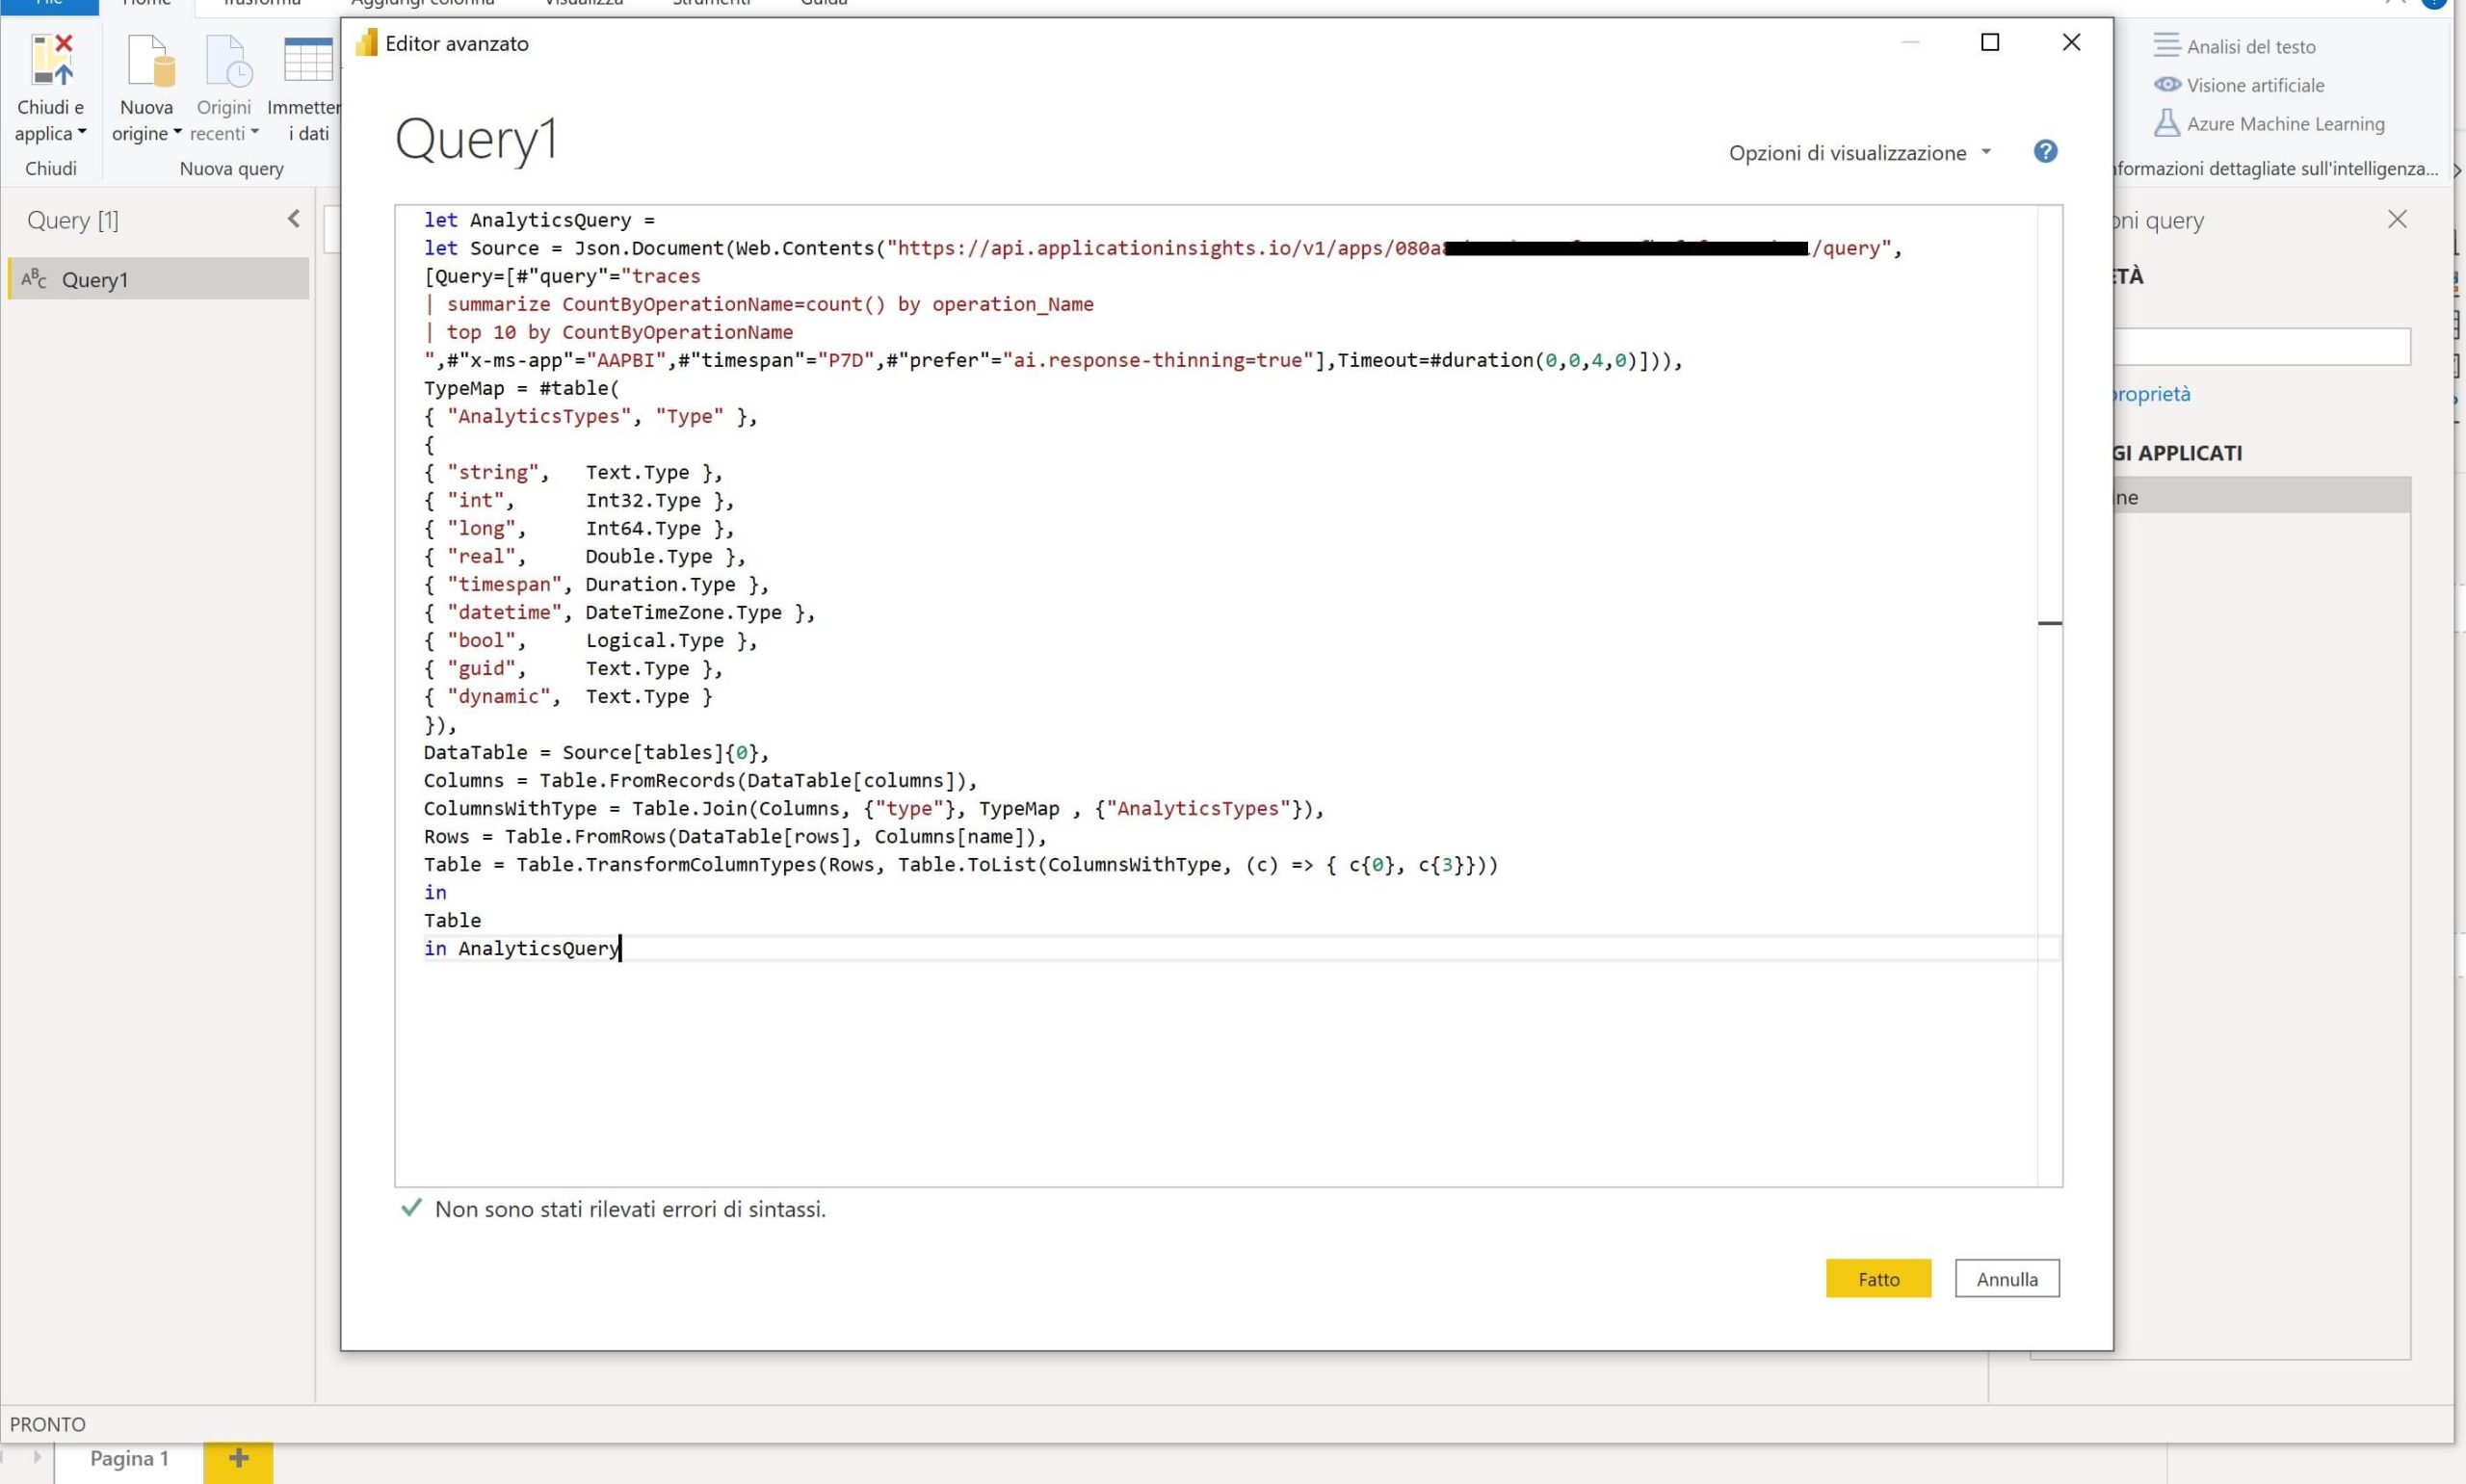
A txt. file containing an M query is downloaded for you.
Now in Power BI Desktop select Get Data -> Blank Query -> Advanced Query Editor, paste the M query into the Advanced Query Editor, and select Done:
Results of the KQL query are now displayed in your Power BI report:
You can create as many queries as you want and embed them into different reports for creating your custom dashboards. Nice isn’t it?
I think this is another powerful tool for monitoring your Dynamics 365 Business Central SaaS instances. Monitoring a tenant is vital for your customer’s experience in the cloud and despite the chosen tool, you should start adopting a monitoring policy. If you want a happy customer in the cloud, don’t under-estimate telemetry.
