Guidelines for Partners
Business Central provides powerful report generation capabilities that allow you to present data in multiple formats. This guide explains the differences between all available Business Central Report Layouts types, so you will be able to decide which layout best suits your needs.
1. Understanding Reports in Business Central
A report is a critical component of Business Central that serves as a bridge between raw data stored in your database and formatted information that a user can read. Reports extract data from one or multiple database tables, apply business logic and calculations to transform the raw data into meaningful information. They also organize and structure that information according to specific requirements and present it in a format fit for various purposes: printing, emailing, or further analysis.
1.1. Understanding Business Central Report Layouts
A report layout is the visual and structural blueprint that defines exactly how your data will be presented to the end user. The critical distinction is this: the report object which you write in AL code defines what to gather and processes the data, while the layout defines how that data should be presented visually.
1.2. Report Architecture
Every report in Business Central consists of several intertwined components working together:
- Data Section: Where you declare which database tables your report will access, which fields from those tables you need, how those tables relate to each other, and what filters and sorting the user can apply. This section is defined in the AL code using dataitem declarations.
- Request Page: The interface that appears when a user runs the report. The request page consists of the fields, groups, and controls that allows users to specify parameters, apply filters, set options. For example, a sales report might allow users to filter by date range, customer, or product type.
- Processing Logic: The business logic that executes as the report runs. This includes trigger events that run at various points in the report, calculations and transformations applied to the data, conditional logic that determines what data to include or exclude, and any complex business rules that need to be applied.
- Layout Template: The visual presentation layer that formats and displays the processed data. The layout takes the data that the report has processed and presents it in a user-friendly, properly formatted manner. This is where fonts, colors, borders, images, and all visual elements are defined.
1.3. Processing-Only Reports
Processing-only reports represent a special report type in Business Central that focuses purely on data processing rather than presentation. Unlike standard reports, they do not contain layouts and therefore produce no visual output. Their main purpose is executing business logic over a dataset, such as batch updates, calculations, validation, or automation tasks. A request page can optionally be provided to allow users to define filters or parameters, but it is not required for the report to run.
2. The three primary types of Business Central Report Layouts
Business Central provides three distinct layout technologies, each with its own strengths, weaknesses and ideal use cases. Understanding the nuances of each is crucial for making the right choice for your specific reporting needs.
2.1. RDLC (Report Definition Language Client)
What is RDLC?
RDLC is based on a standardized XML format that was originally developed by Microsoft for SQL Server Reporting Services. In Business Central, RDLC layouts are processed on the client side, allowing for rich formatting and interactive features. RDLC uses a visual designer interface that lets you drag and drop elements onto a design canvas, seeing your report layout in real-time as you build it which makes it very intuitive for report designers.
Advantages of RDLC Layouts
RDLC provides great tools for creating professionally formatted reports with precise control over every visual element. You can specify exact positioning, colors, fonts, borders, and spacing. Also, the visual designer allows non-technical users or designers to build reports without touching code. You can drag fields onto the canvas and see exactly how they’ll appear. In addition to that, RDLC is optimized for print output. When you export an RDLC report to PDF, the result is typically perfect for printing – margins are correct, page breaks occur naturally, and the printed version looks almost identical to the screen preview. Another very useful tool is that it is possible to create expressions within RDLC that format data based on its values. For example, you might display negative numbers in red, or format decimal values differently based on the document type.
Disadvantages of RDLC Layouts
However, RDLC also has some limitations. When reports contain very large datasets, such as tens of thousands of rows, performance can become slower because the rendering engine must process all data and apply formatting rules before showing the result. Although RDLC supports grouping and totals, creating complex multi-level summaries across different data dimensions can be difficult. Developers often encounter scope-related issues or missing values when trying to implement advanced aggregations. RDLC can display text, but it is not as flexible as Word when complex text formatting or long narrative content is required, because RDLC is mainly designed for structured and tabular data.
Ideal Use Cases for RDLC
RDLC works best when reports need clear structure and professional formatting, especially when they are printed or viewed as fixed documents. It is well suited for documents such as sales invoices that must look professional when sent to customers, customer statements that require clear presentation of transactions, inventory reports that depend on precisely aligned tables and totals and more.
2.2. Word Layouts
What is Word Layout?
A Word layout is a Microsoft Word document (.docx file) that acts as the template for a report. The layout is created directly in Microsoft Word. The document contains content controls, which are placeholder fields connected to data fields from the report. When the report runs, Business Central replaces these placeholders with actual data from the dataset, allowing the final document to be generated using the Word template. The architecture is based on Office Open XML, the standard format used by modern versions of Microsoft Word. This approach is powerful because it controls Word’s native capabilities for text formatting, styling, and document structure so you can use every feature Word offers.
Advantages of Word Layouts
Word layouts offer strong advantages when reports contain a lot of text or narrative content. Word is much more flexible than RDLC for flowing text, multiple paragraphs, and complex document structures. It allows detailed control over formatting, spacing, and layout while keeping text readable and natural. Another important advantage is that business users can open the template directly in Word and make changes themselves, such as adjusting fonts, headers, colors, or layout, without needing developer involvement. Word documents are also easy to share and collaborate on, since recipients can open them directly, add comments. Although RDLC provides stronger table functionality, Word tables are capable enough for most business needs, and users are generally familiar with working with them.
Disadvantages of Word Layouts
Word layouts have several limitations. Performance can become an issue when reports contain thousands of rows, because the rendering engine must create content controls for each data row, which can be slow. Word is designed primarily for documents rather than data analysis, so creating summaries, running totals, or complex aggregations is less practical compared to RDLC. Word also does not provide native chart functionality that automatically updates based on report data. Maintaining layouts can become difficult as report structures change, since the Word template and report code must remain synchronized. In addition, because users can edit templates directly, there is a risk that content controls may be accidentally moved, deleted, or modified in ways that break the layout.
Ideal Use Cases for Word Layouts
Word layouts are best suited for reports that are essentially documents with embedded data. Typical examples include customer welcome letters, payment reminder notices, contract templates, business proposals, and employee communications where personalized text and readable document structure are more important than strict tabular formatting.
2.3. Excel Layouts
What is Excel Layout?
An Excel layout is a Microsoft Excel spreadsheet (.xlsx file) that acts as the template for your report. Like Word layouts, Excel layouts are templates that contain placeholder references to data fields from your report and when the report runs, these references are replaced with actual data from your dataset. Excel layouts are optimized for data-driven spreadsheets where users will perform analysis, calculations, and create visualizations. Excel layouts are based on the Office Open XML Spreadsheet ML format, the same XML standard that modern Excel uses. The layout file contains named ranges, cell formulas, and special markers that indicate where report data should be inserted.
Advantages of Excel Layouts
Excel layouts are particularly strong for data-heavy and analytical reports. They perform well even with large datasets containing thousands or tens of thousands of rows. Users can immediately use Excel’s built-in tools such as filtering, sorting, pivot tables, and other analysis features without any additional steps. Formulas can be embedded directly in the layout, allowing calculations to update automatically as data is populated, and users can extend these calculations themselves if needed. Excel also provides strong charting capabilities, allowing users to create visualizations directly from report data. Since most business users are already familiar with Excel, the learning curve is minimal.
Disadvantages of Excel Layouts
Excel layouts are less suitable when reports need professional printed output. Spreadsheets often do not print well, since page breaks and formatting may appear inconsistent and the printed result is usually less polished than other layouts. Excel is also not intended for advanced visual document design, so creating branded or highly formatted documents can be challenging. Multi-page documents are harder to manage in Excel because it is structured around spreadsheets rather than as document flow. As with Word layouts, users can accidentally break templates by deleting formulas or changing the structure. Excel is also less suited for hierarchical or nested data structures, which often require additional workarounds to represent clearly.
Ideal Use Cases for Excel Layout
Excel layouts are ideal for analytical reports where users need to work further with the data. Common examples include sales analysis reports, financial forecasts and budgets, inventory analysis, employee expense reports, and product sales summaries where filtering, calculations, and further analysis are expected after the report is generated.
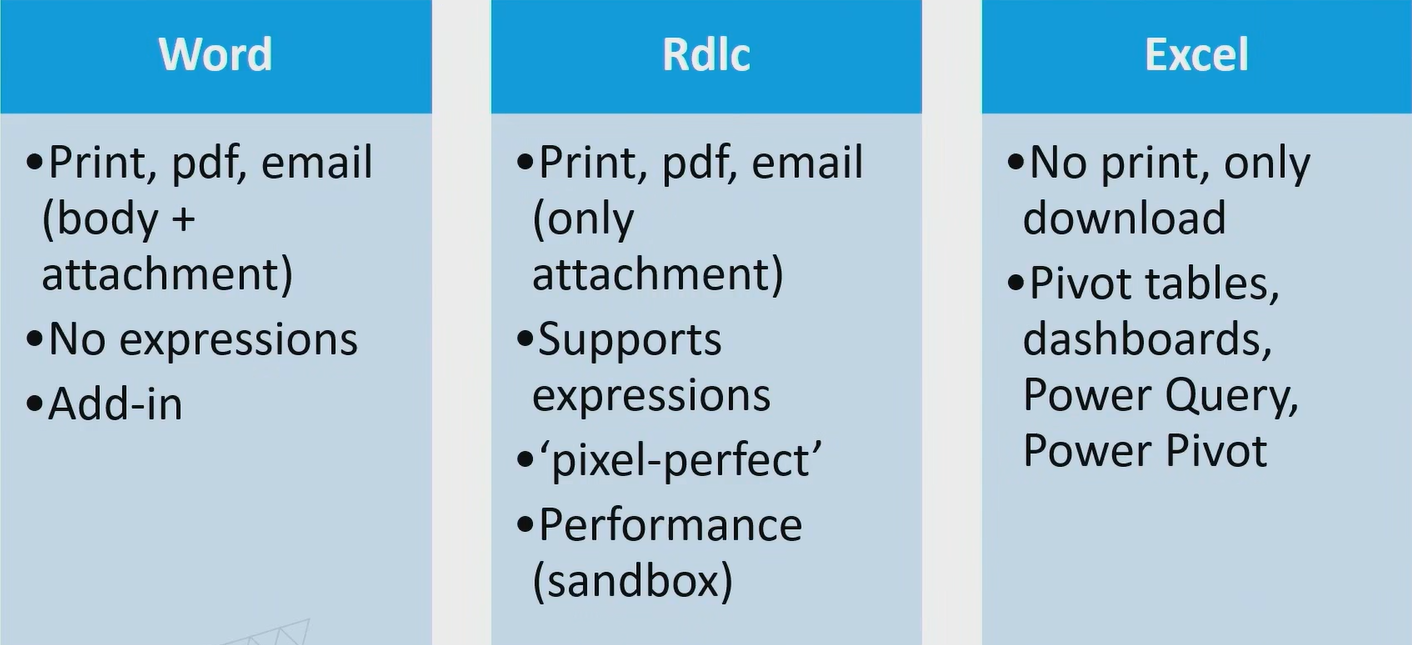
Here is a summary of the layout advantages, taken from the presentation at the BC TechDays 2025 conference of 12 & 13 June 2025 in Antwerp, Belgium:
3. One report, different layouts example
For this example, layouts were tried to create as similar as possible, having only one report written in AL.
3.1. Report code
report 50100 “Item Sales Analysis Report”
{
ApplicationArea = All;
Caption = ‘Item Sales Analysis Report’;
UsageCategory = ReportsAndAnalysis;
DefaultRenderingLayout = RDLC;
dataset
{
dataitem(Item; Item)
{
RequestFilterFields = “No.”, “Item Category Code”;
DataItemTableView = sorting(“No.”);
column(No_Item; “No.”)
{
}
column(Description_Item; Description)
{
}
column(UnitPrice_Item; “Unit Price”)
{
}
column(Inventory_Item; Inventory)
{
}
column(ItemTotalQty; ItemTotalQty)
{
}
column(ItemTotalAmount; ItemTotalAmount)
{
}
dataitem(“Sales Line”; “Sales Line”)
{
DataItemTableView = where(“Document Type” = const(Order));
DataItemLink = “No.” = field(“No.”);
column(DocumentNo_SL; “Document No.”)
{
}
column(ShipmentDate_SL; “Shipment Date”)
{
}
column(CustomerNo_SL; “Sell-to Customer No.”)
{
}
column(Quantity_SL; Quantity)
{
}
column(LineAmount_SL; “Line Amount”)
{
}
}
trigger OnAfterGetRecord()
begin
CalcItemTotals(“No.”);
end;
}
}
requestpage
{
SaveValues = true;
}
rendering
{
layout(“RDLC”)
{
Type = RDLC;
LayoutFile = ‘ItemSalesReport.rdlc’;
}
layout(“Word”)
{
Type = Word;
LayoutFile = ‘ItemSalesReport.docx’;
}
layout(“Excel”)
{
Type = Excel;
LayoutFile = ‘ItemSalesReport.xlsx’;
}
}
labels
{
ReportCaption = ‘Item Sales Analysis’;
}
local procedure CalcItemTotals(ItemNo: Code[20])
var
SalesLine: Record “Sales Line”;
begin
ItemTotalQty := 0;
ItemTotalAmount := 0;
SalesLine.SetRange(“No.”, ItemNo);
SalesLine.SetRange(“Document Type”, SalesLine.”Document Type”::Order);
if SalesLine.FindSet() then
repeat
ItemTotalQty += SalesLine.Quantity;
ItemTotalAmount += SalesLine.”Line Amount”;
until SalesLine.Next() = 0;
end;
var
ItemTotalQty: Decimal;
ItemTotalAmount: Decimal;
The report retrieves item records from “Item” table and displays them together with related sales order lines from “Sales Line” table. Each item serves as a parent record, while its corresponding sales lines are shown underneath, creating a clear hierarchical structure. The report fetches basic item information such as item number, description, unit price, and inventory, along with sales details like document number, customer, shipment date, quantity, and line amount.
3.2. Business Central Report Layouts
Three different, but similar layouts for this report were created, each using the same dataset. The main goal during creation was to keep the data structure identical across all layouts so that the comparison would clearly show how presentation changes depending on the layout type rather than changes in logic or data. Attention was focused on making sure that items and their related sales lines were displayed correctly as a hierarchy, since this relationship is the core of the report.
The RDLC layout
It was the most straightforward to structure because it naturally supports grouped data and totals. The focus here was on visual accessories, such as colors of the fonts and conditional formatting, and ensuring that totals were correctly calculated. Most effort went into arranging the tablix structure so that item information and sales lines were clearly separated while still visually connected. That is why a table with two repeaters was used – one for Item, another for Sales Lines.
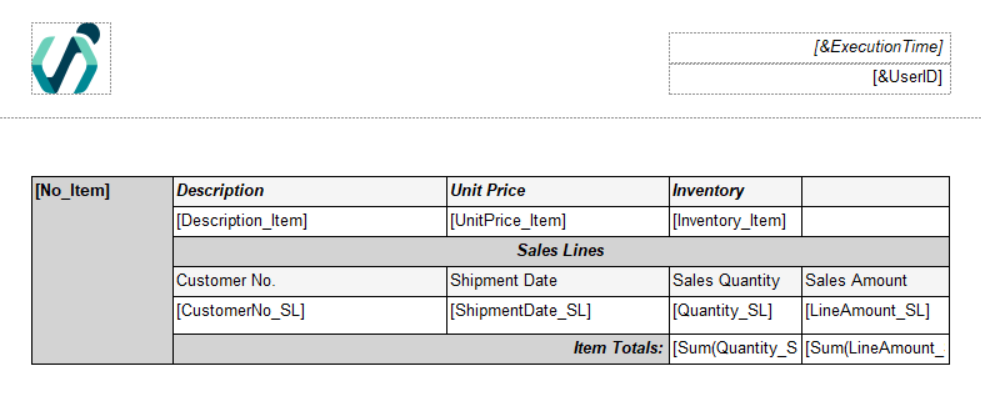
Item totals were created directly in the layout, since RDLC provides this option and it was easier to do so, since the layout understands the hierarchy itself. The final output with filtered 2 items:
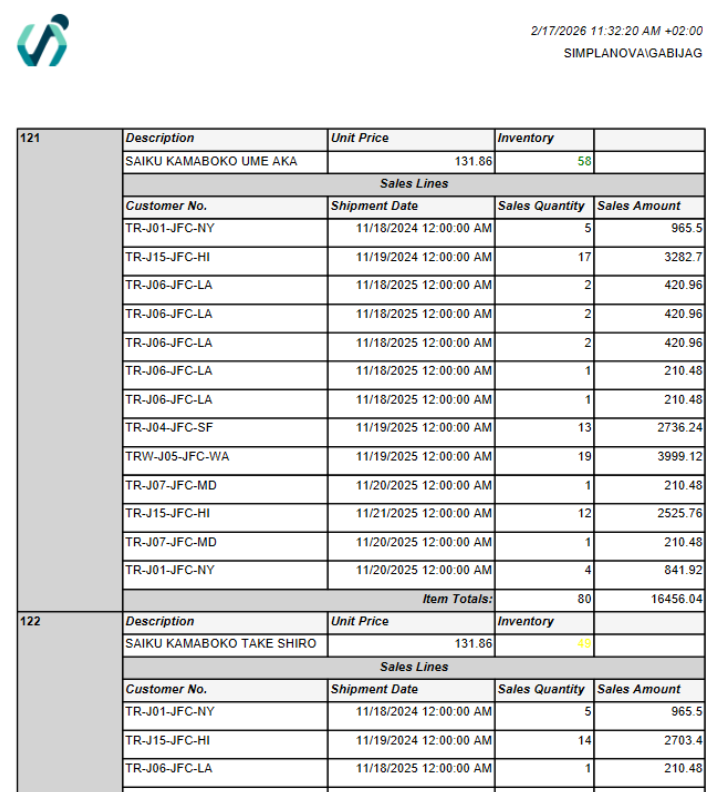
The inventory shows green 58 for Item No. 121 and yellow 49 for Item No. 122, since the condition for color format is red for below 10, yellow for below 50 and green for over 50. Since it was the first layout created, the other 2 were intended to be identical, but that was not actually possible.
The Word layout
It required a different approach because it does not behave like a traditional reporting tool. Special attention was needed to correctly place repeating sections so that sales lines repeated inside the item structure without creating duplicate elements. The biggest difficulty appeared in understanding how Word repeaters interpret hierarchy, since incorrect placement caused missing fields and different errors when the dataset itself was correct.
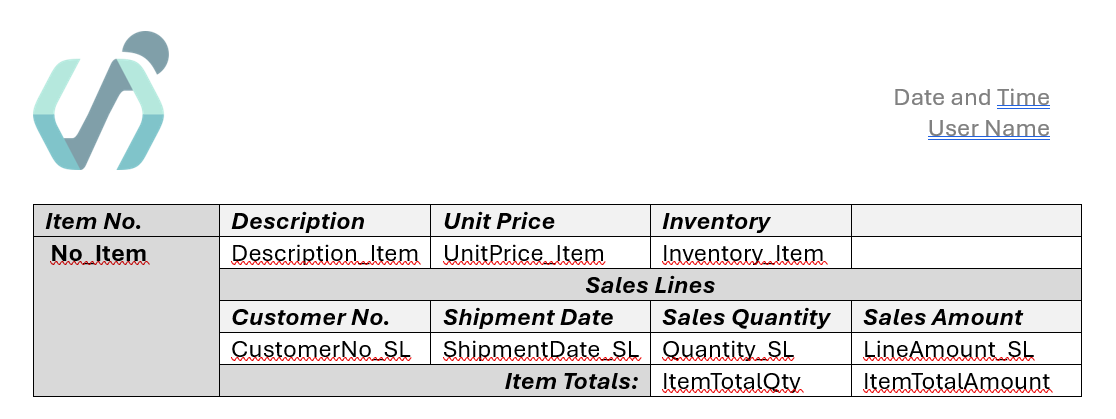
The layout looks somewhat identical to RDLC; however, the Item Totals were not summed in the Word itself and dynamic conditional formatting on Inventory does not exist, since there is no possibility to do so. That’s why in the AL side of the report, 2 new variables were added and calculated through dataitem triggers to show the totals. The visual of the same 2 items:

It is more compact, since the columns were not made to be exactly like RDLC, not as colorful, but other than that everything looks very similar.
The Excel layout
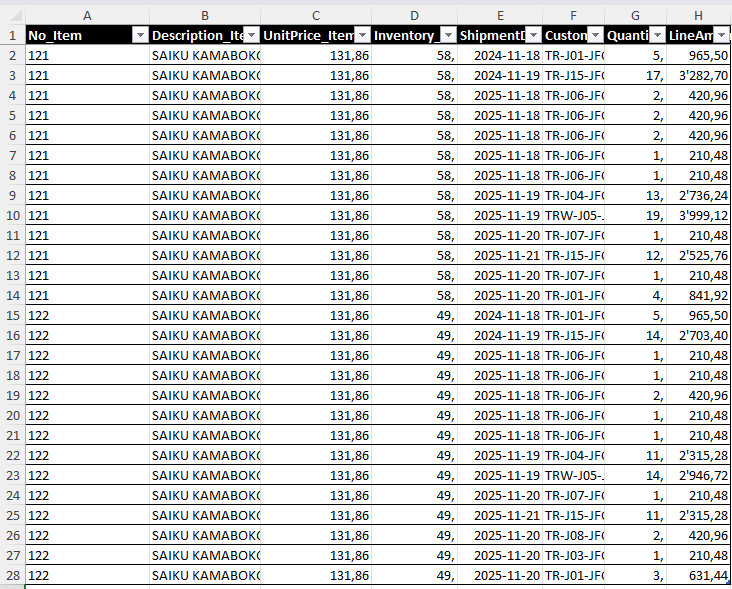
The most difficult one to think and create, since it is focused on analysis rather than presentation. The main point was to try and make the layout, since it is not the most important thing in Excel documents. When opening the excel layout template, there are several worksheets created, like Aggregated Metadata, Captions and etc. All of them was hidden and only 2 were left: Data and custom created worsheet Layout. The Data worksheet looks just like any other detailed data would look like – rows of information.
In the Layout worksheet, the pivot table was created and the data for it was used from the Data worksheet.
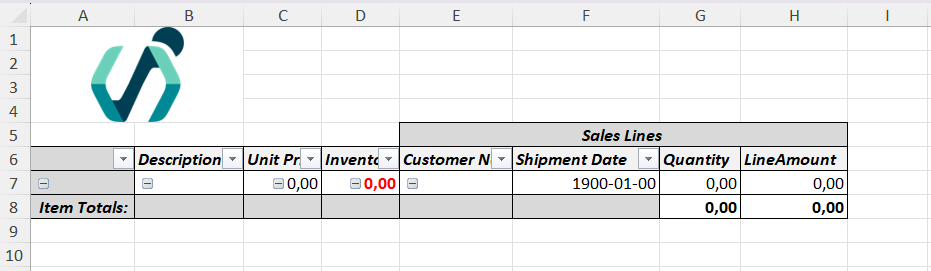
The layout in Excel was far from identical – there is no possibility to insert a free line for headers in the pivot table. That is why the document with filtered same two items look like this:
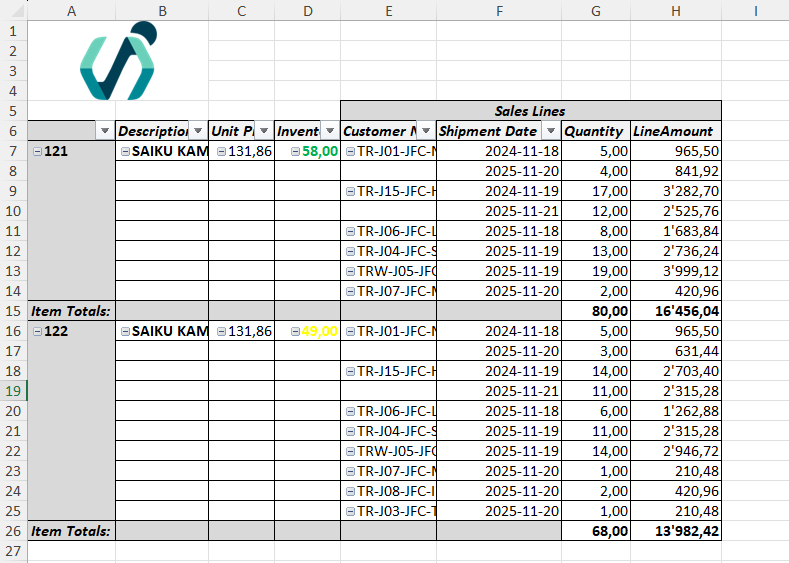
Unlike in Word, the inventories have their conditional format, and the sums are calculated directly in the Excel as well, without a need of additional variables.
Summary of Comparing Business Central Report Layouts
The shown example demonstrates how a single Business Central report can deliver very different results depending on the selected layout, even when the dataset and business logic remain unchanged. The RDLC layout provided the most controlled and structured result, handling hierarchy, totals, and conditional formatting directly in the layout and producing a report suitable for presentation or printing. The Word layout achieved a similar structure but required more attention to repeater placement and relied on calculations performed in AL, highlighting that Word is better suited for document-style output rather than data-driven formatting. The Excel layout approached the same data from an analytical perspective, separating raw data from presentation and enabling further analysis through pivot tables and formulas rather than visual design.
The comparison shows that layout choice should be driven by the purpose of the report rather than by technical preference. Even when Business Central Report layouts are designed to look similar, their internal behaviour and limitations remain different. Understanding these differences in Business Central Report layouts allows reports to be designed more efficiently and aligned with real business usage.