Simplanova believes, that creating reports should be as intuitive, simple and quick as the original Classic version. To bring this historic level of simplicity into the modern development environment, we have created the Simplanova Report Wizard, which will cut the time spent on repetitive tasks, reduce the risk of error and streamline the report creation process.
We have recently completed our phase 1 of 5 in developing the Simplanova Report Wizard – a tool, which will revolutionize building Microsoft Dynamics NAV report development. It’s workflow will take the best from all Dynamics NAV platforms: the current report designer (dataset building, terminology), Classic reports (sections) and page designer (grid-layout, tree-like structure, automatic control placement). The biggest challenge for developers is to make the NAV report process quick and easy. The Simplanova Report Wizard will do this and deliver what developers are dreaming about. By using this tool, developers will be able to create RDLC reports in RTC client without using any external software. The tool will help reduce the time spent on repetitive tasks and eliminate the risk of human error.
Using Simplanova Report Wizard is much quicker and more convenient than building reports using the regular RTC report designer. Usability is even better than the Classic report version with the ability to build an easy grid flow, following the page designer logic.
Development
The development of Simplanova Report Wizard went according to the plan and we have a working version of the tool, ready for Phase II development and internal user testing. The goal was to build the initial setup, allow users to create new reports, build the dataset (replicating standard NAV report designer), generate a report and import it to NAV. Actually, we have exceeded the goal and have built some features ahead from the upcoming Phase II, which include building report layout (sections, text boxes, groups, using aggregate functions).
How to create report with Simplanova Report Wizard?
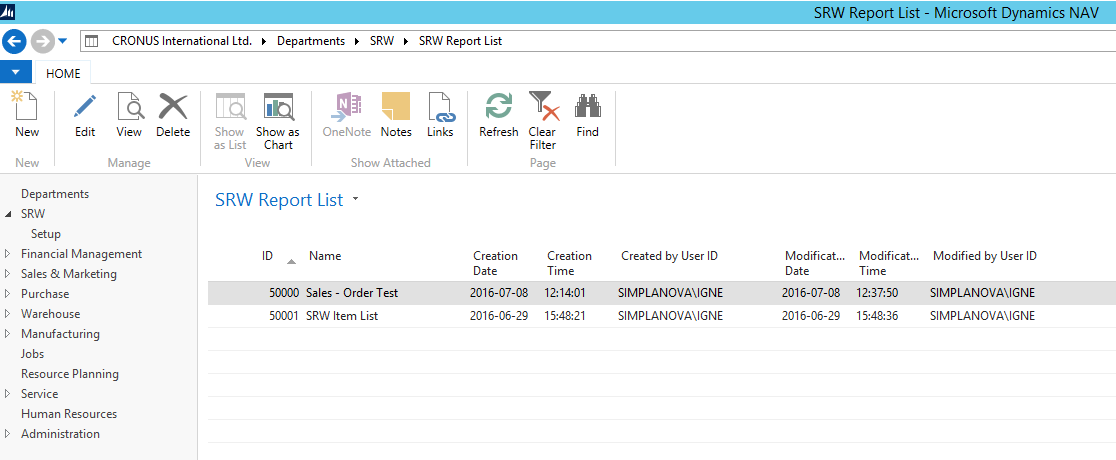
#1 Report List
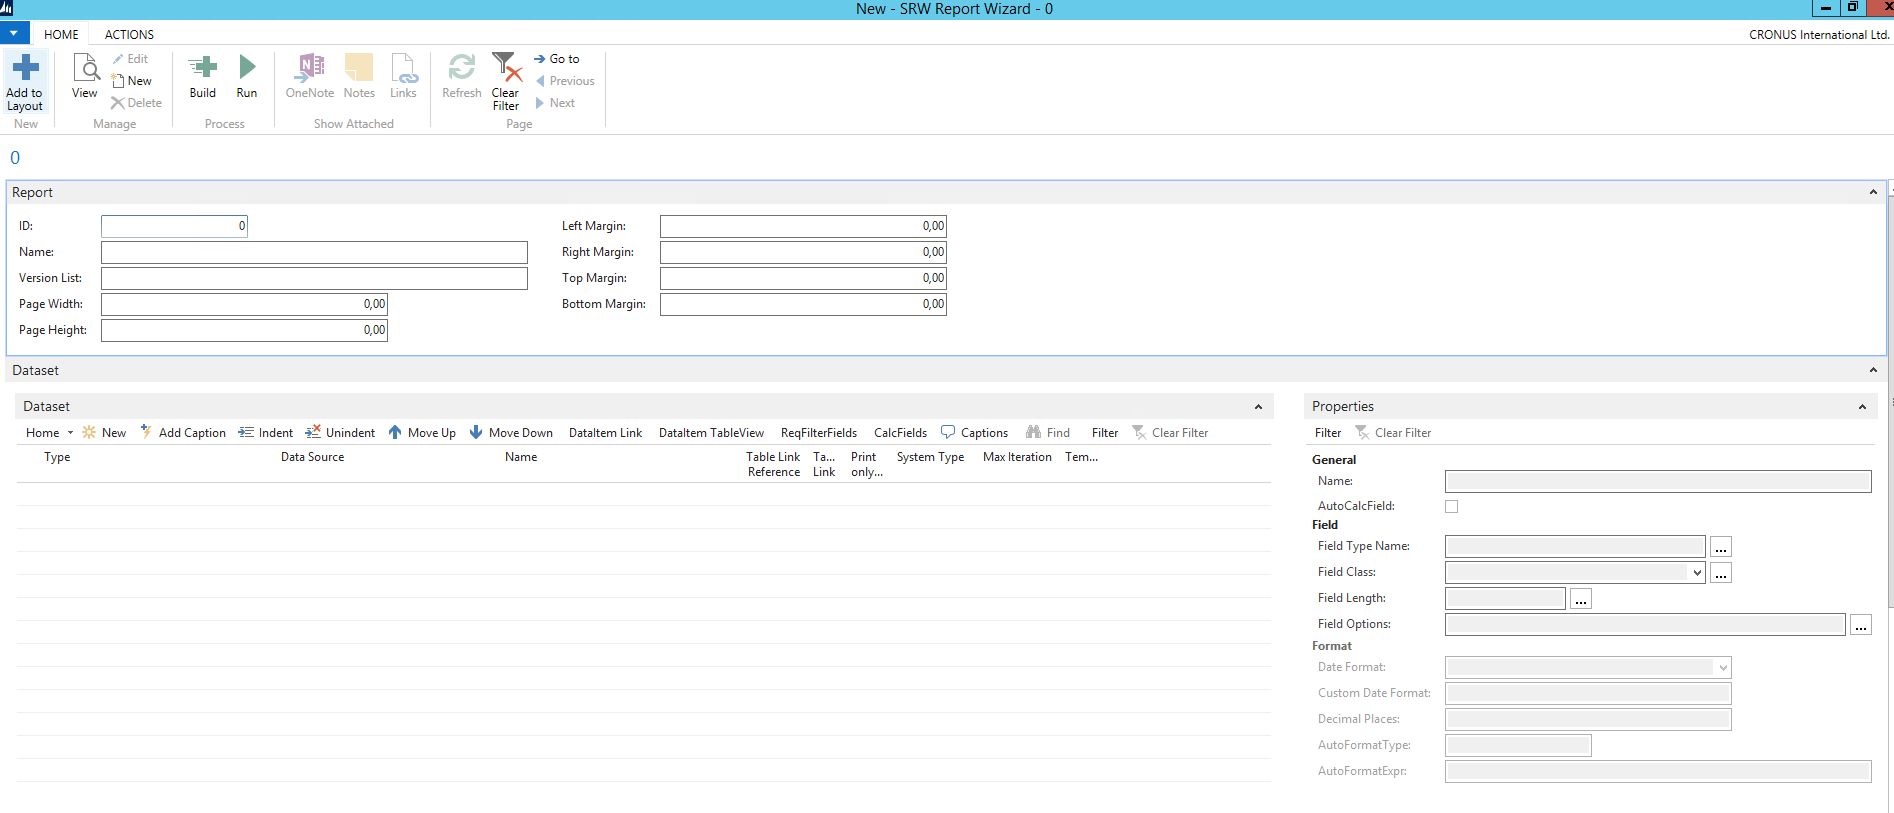
#2 Report properties and DataSet
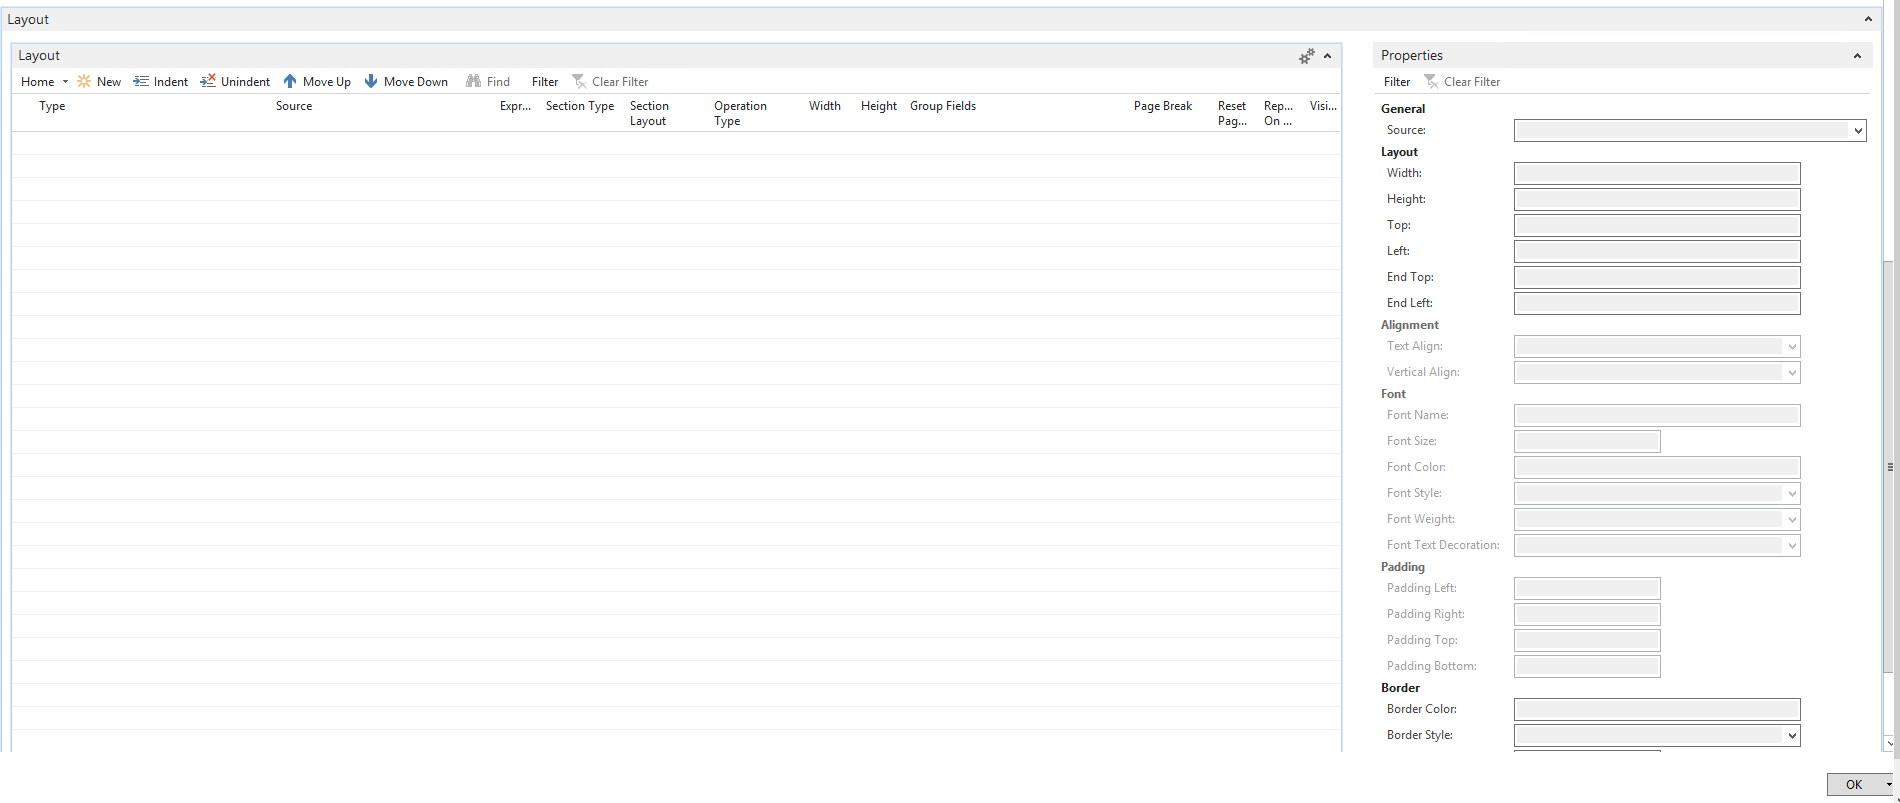
#3 Layout
How to build a list of items?
#1 Setting up the report properties
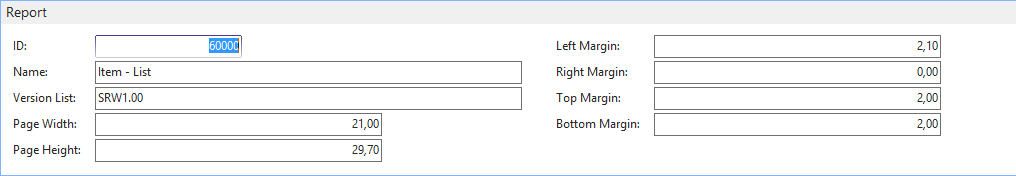
We are entering 60000 as the object ID, Item – List as the Name and SRW1.00 as Version List. The page size and margins pop-in automatically (A4 page size). The defaults can be defined in SRW Setup as either centimeters or inches.
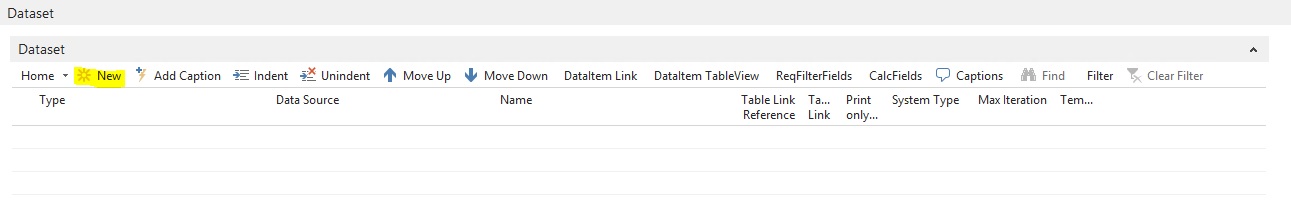
#2 Next we want to set up the text constant for the Item – List label. Click on New in the dataset.
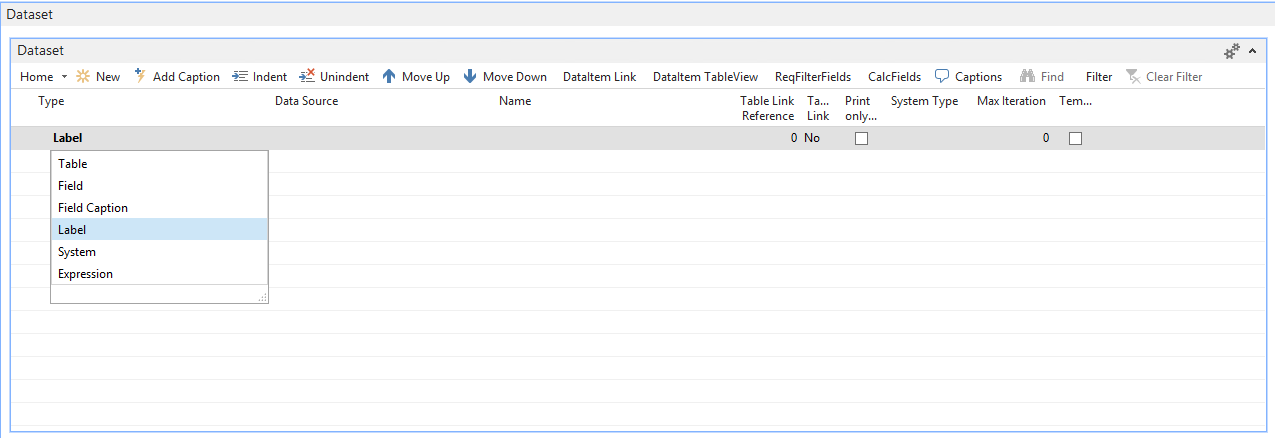
#3 Set the type as Label.
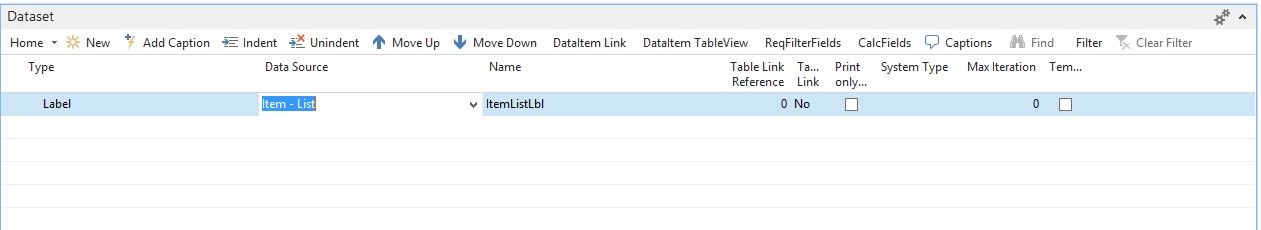
#4 Enter the text to Data Source and set the Name to ItemListLbl. This way I create a label with Item – List set as the caption in the ENU language, which is set as default in my SRW Setup.
#5 After clicking on action New again, I type in Item in the Data Source, the DataSet Name is set automatically.
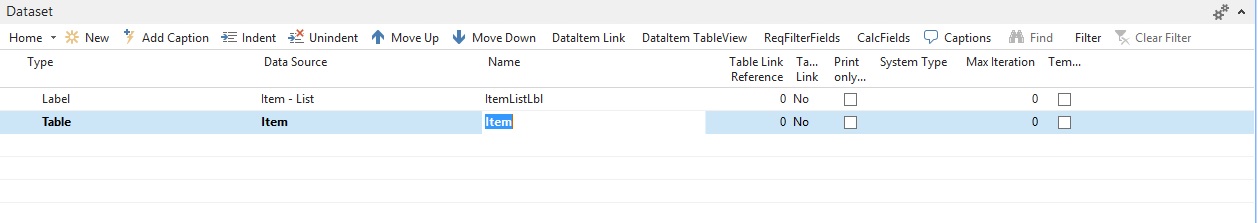
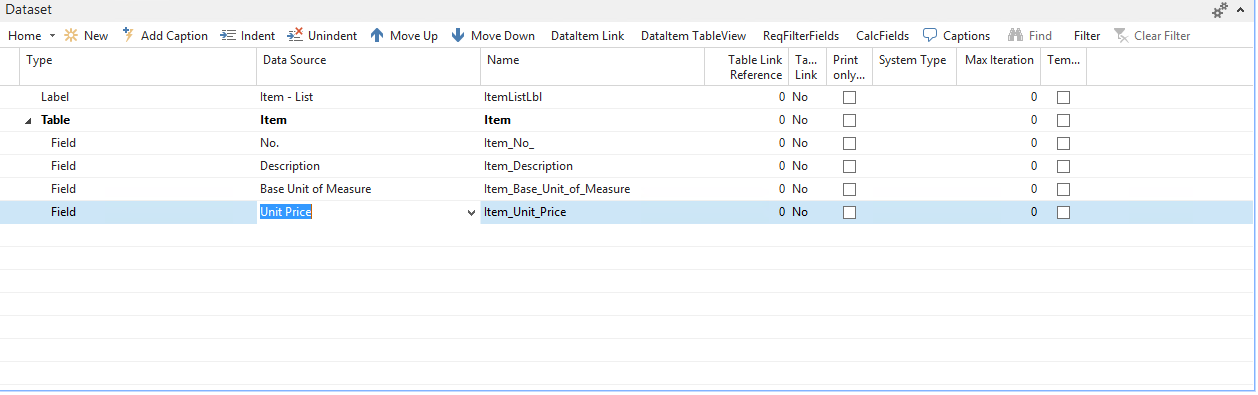
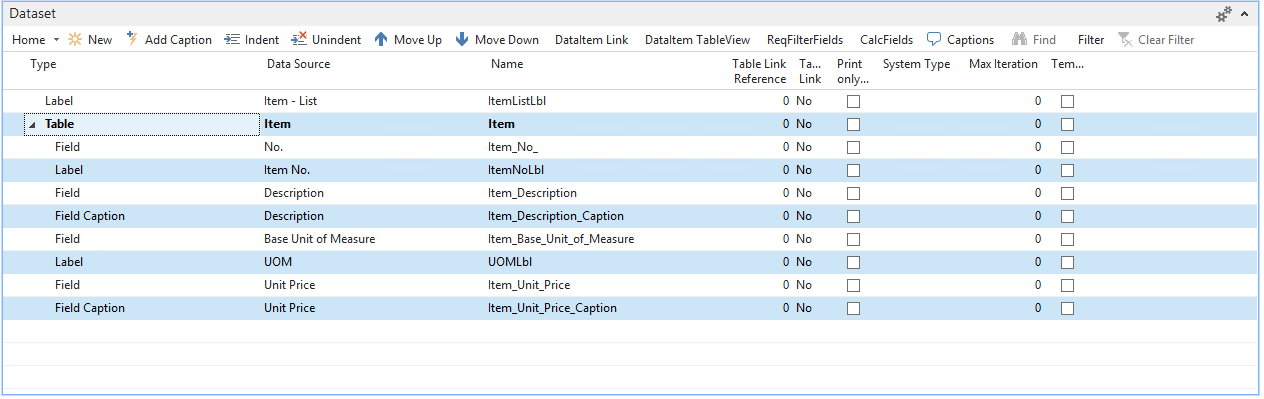
#6 We click on New action numerous times again and type in or lookup from the list all the fields we want to output. Please notice, that all names have been automatically generated in the format of TableName_FieldName.
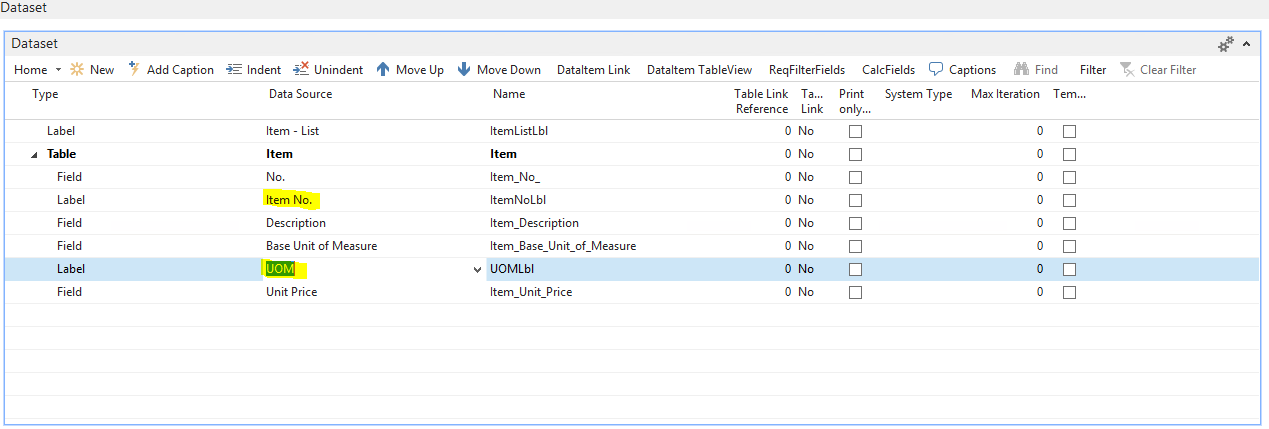
#7 Now we need to create labels for Item No. and UOM.
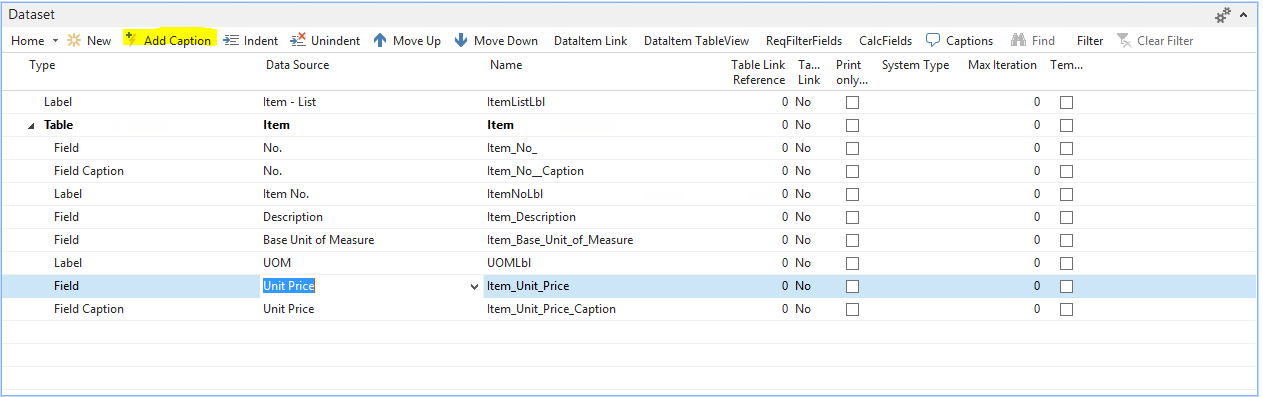
#8 We are adding captions to the two other fields. For that we mark Description field and click on Add Caption button and then do the same with Unit Price. New lines are generated, which have auto-generated names in format TableName_FieldName_Caption.
#9 Now we can move on to building the layout. Up to this point the workflow is very similar to what exists in standard report designer. We want to build the report header with the report name first, so the label Item – List would stay at the top of the report. For this reason we first mark the Item table in the dataset and click on the top button Add to Layout. This automatically generates a section in the layout subpage.
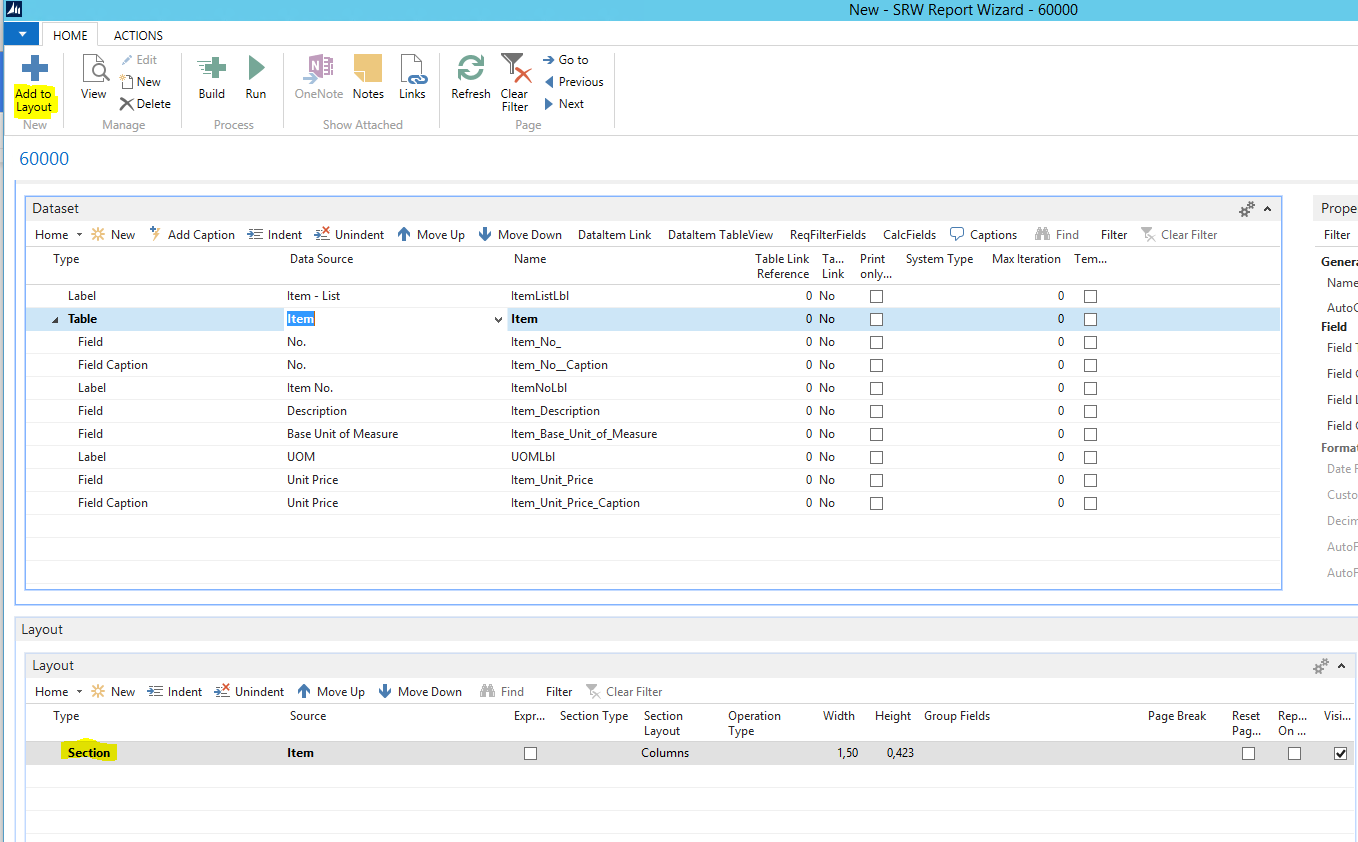
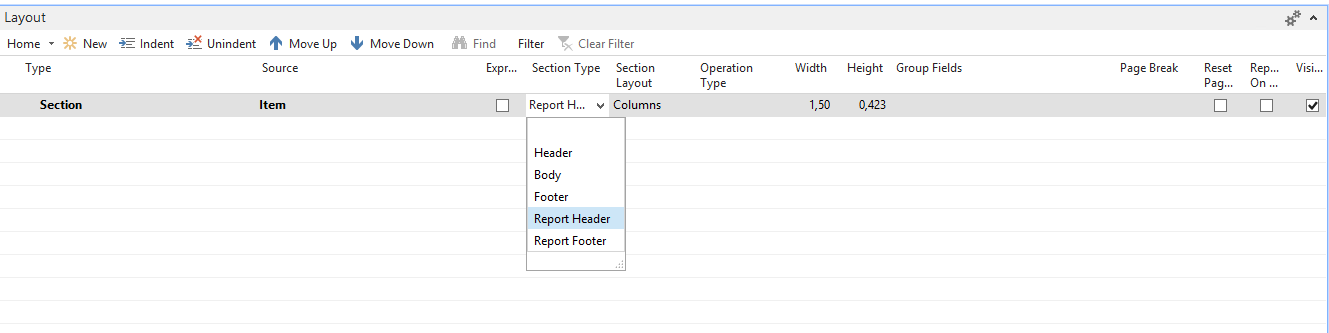
#10 Next we need to set the Section Type to Report Header.
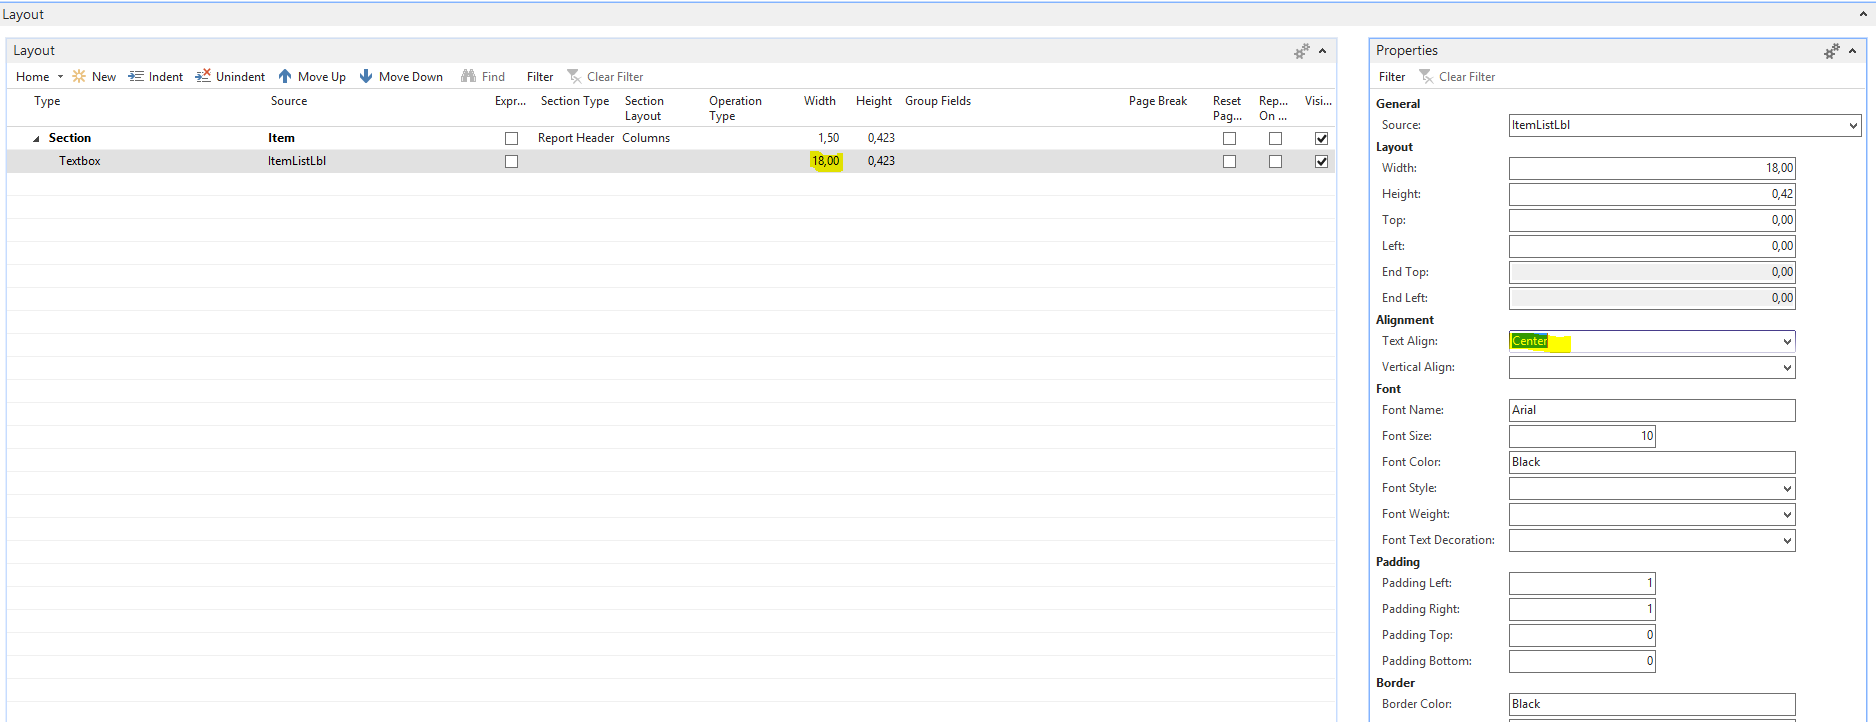
#11 To add the label, we need to select the label ItemListLbl in the DataSet and click on Add to Layout button once more. It creates a new line under the Report Header section. If we want it to be in the center of the page, we need either to set its coordinates to the center or its width to span across the page and to align its text to center. We will do it latter. Additionally, we can set the font size to 14.
#12 To add the Item header section we select all what should be on it. In essence the table, labels and captions.
#13 Click on Add to Layout button. It adds all elements to the layout and sets the caption font weights to bold. The only thing that’s left is to set the Section Type to Header.
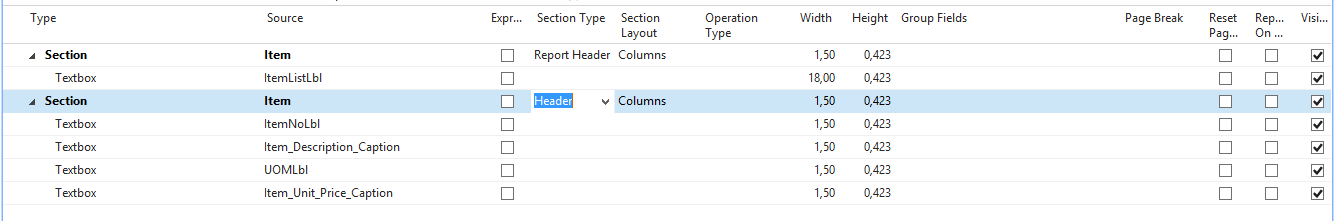
#14 After that, we want to add the body section by following the same step – selecting the table and all the fields and clicking on Add to Layout. Just set the Section Type to Body now.

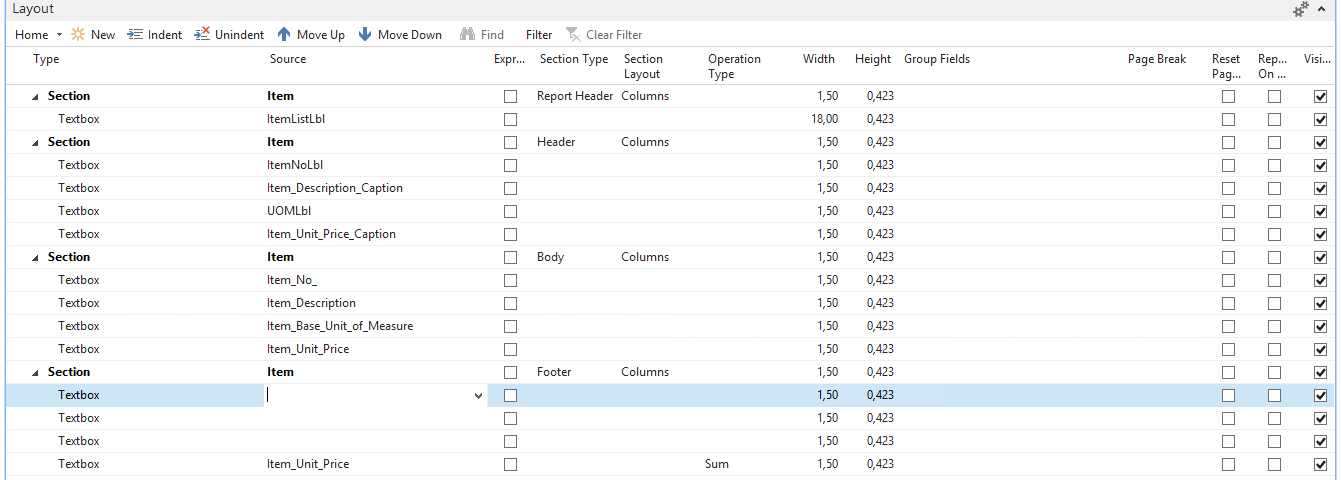
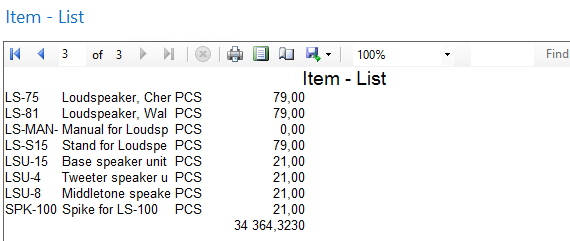
#15 For the last section (the footer with sum) we want to add only the Unit Price and the section, so we select these two and add to the layout. Then set the Section Type to Footer and the Operation Type for the Unit Price to Sum (the way it’s shown below).
![]()
#16 For this sum to align with the other Unit Prices, we need to insert three blank textboxes above it.
#17 Now we can click on Build to see the initial results. This exports the layout behind the scenes and sends it to Simplanova Report Wizard back end, which builds the NAV report object, imports it into the database and compiles it automatically.
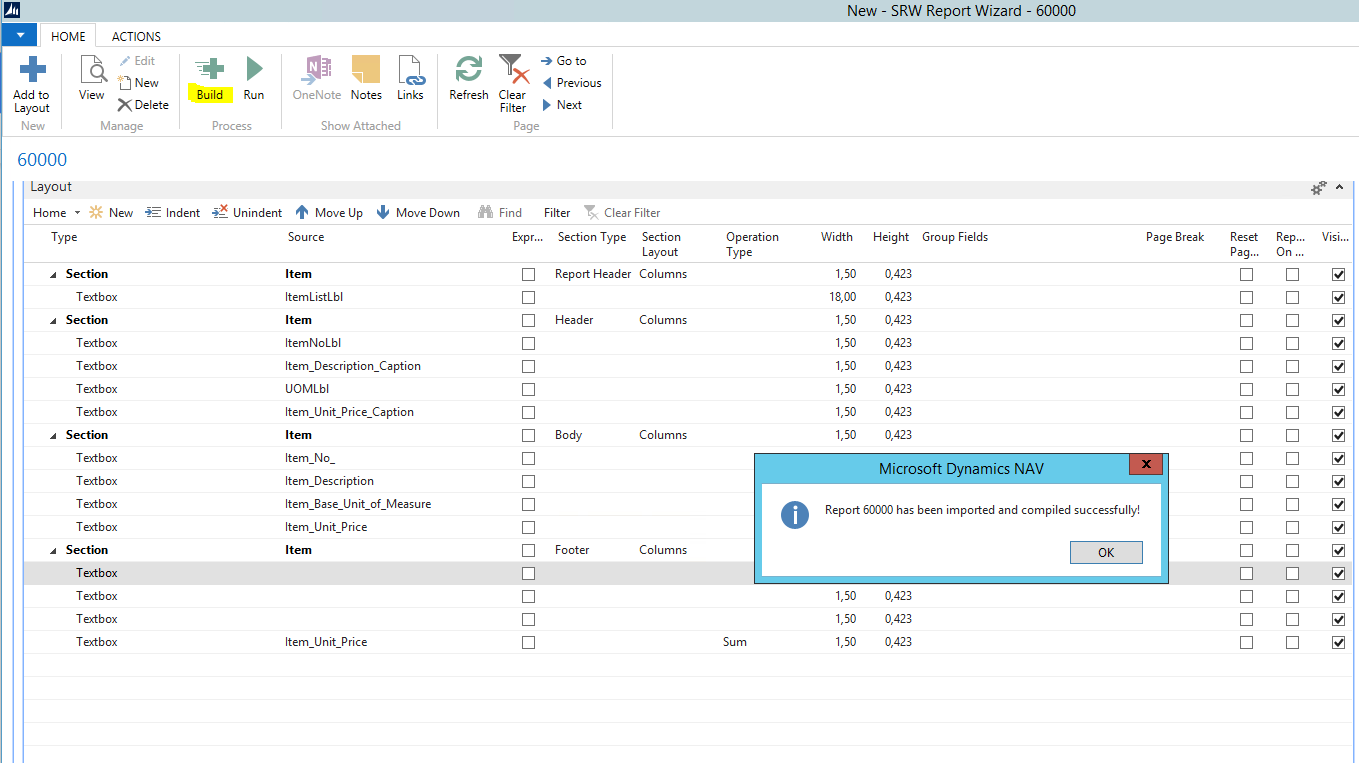
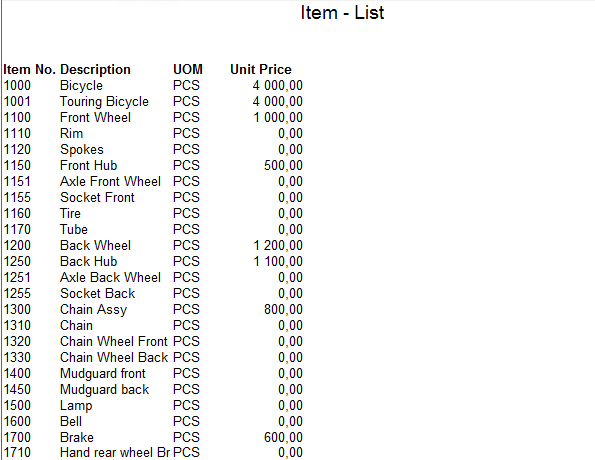
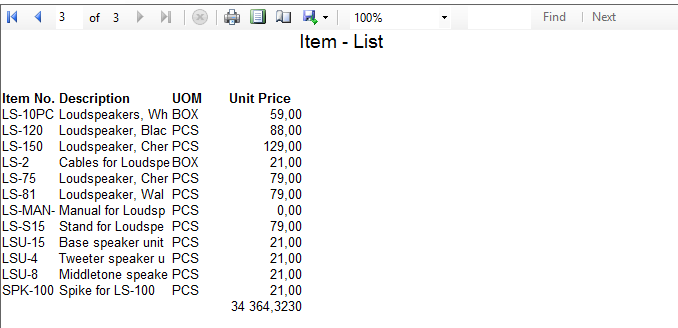
#18 Since it’s been built and compiled, we can run it straight from the Report Wizard using Run action.
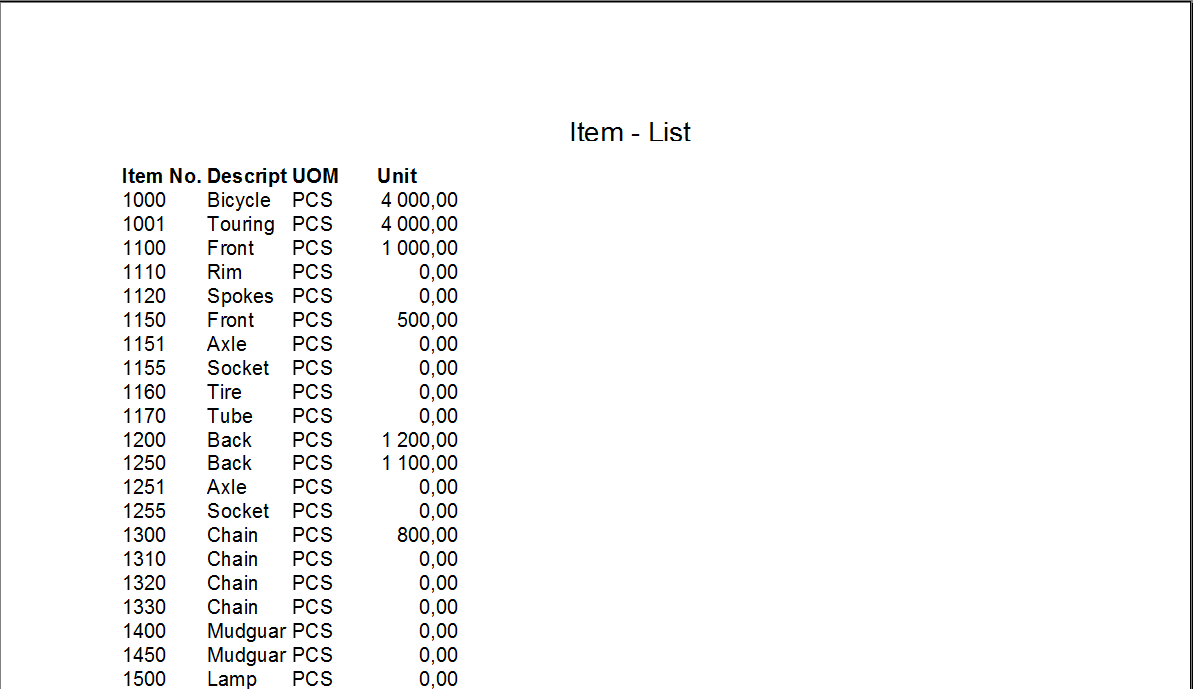
#19 It looks a bit crowded, so we need to increase the height of the report name and the widths of Description and Unit Price. It’s important to do the same to elements in the body and footer sections, so they are all in-line.
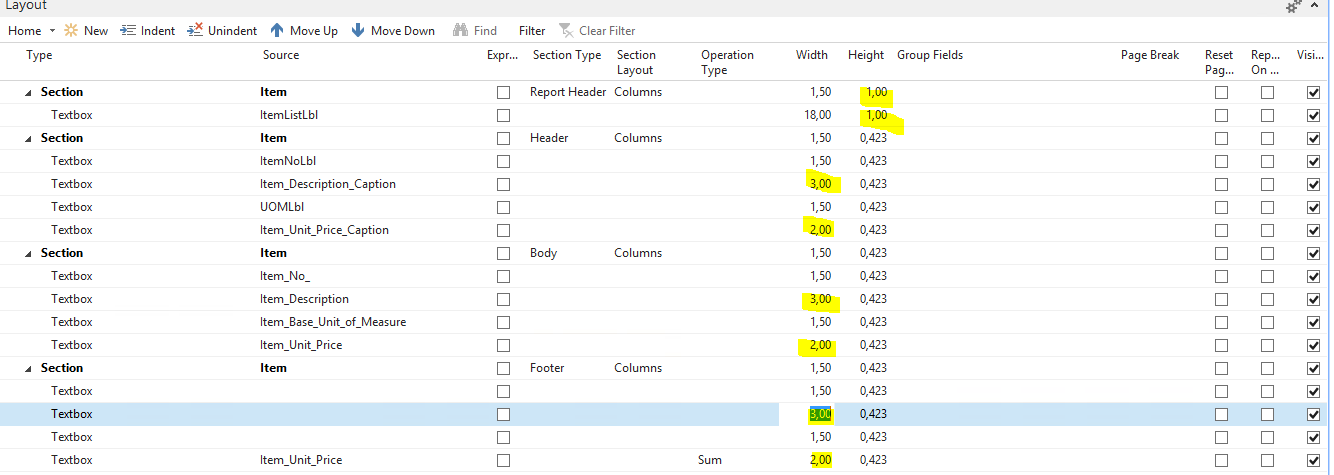
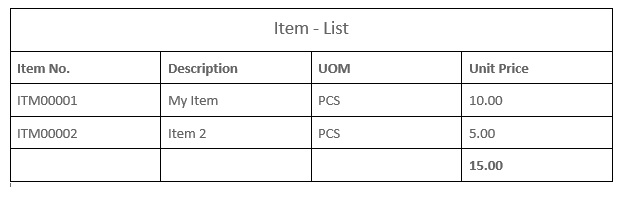
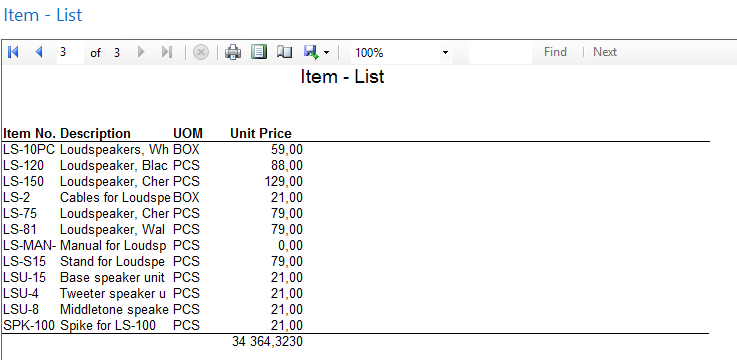
After rebuilding the report once more, the result looks great.
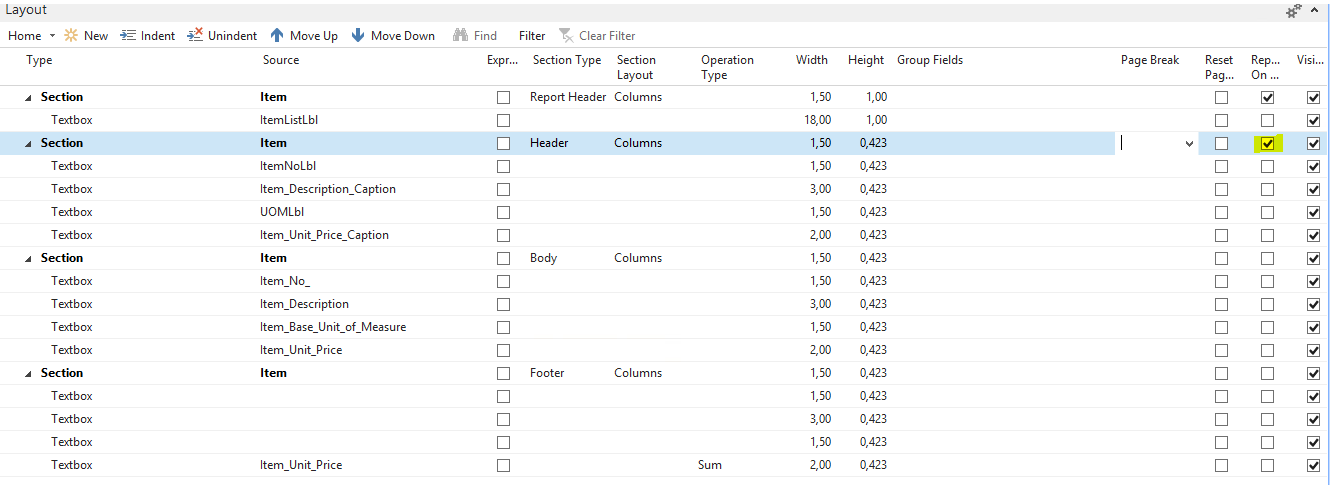
#20 We can do a few more adjustments. The first one could be making the header captions print on every page. For this we need to mark the Print on Every Page checkbox on the correct section.
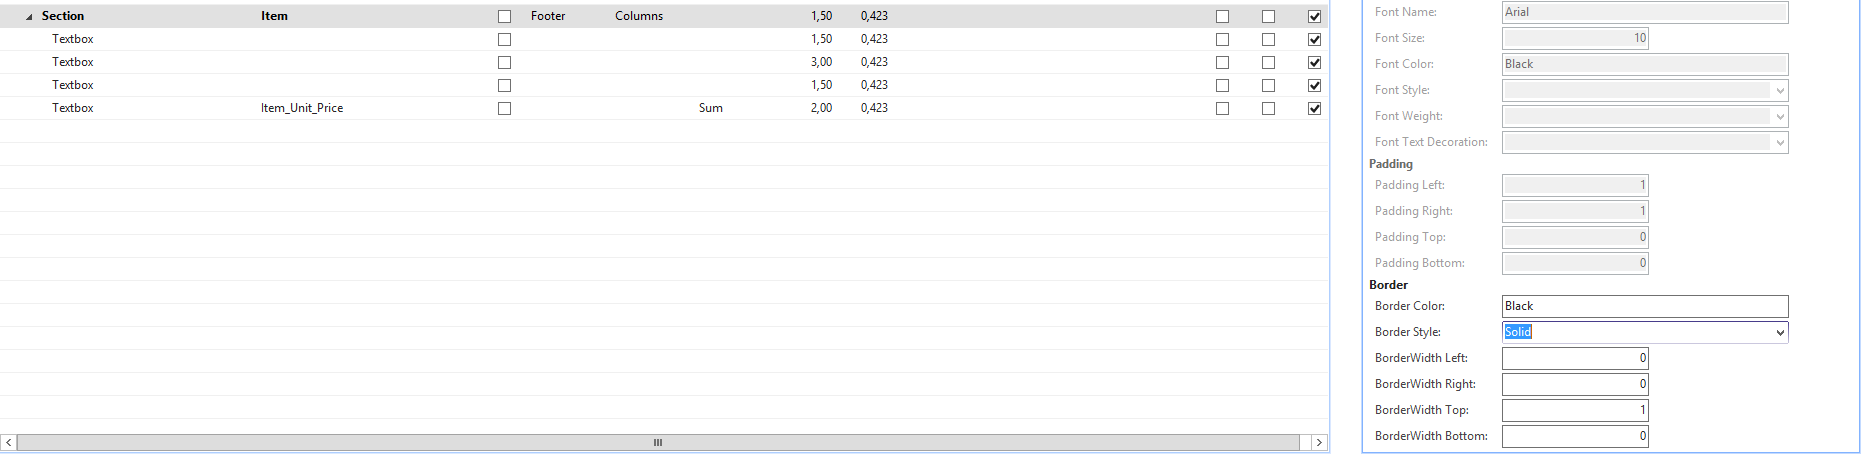
#21 Another adjustment could be adding horizontal lines underneath the header captions and above the total. For this we need to set the Border Style of the Header and Footer sections to Solid and to set the BorderWidth Bottom and Top properties to 1 point accordingly.
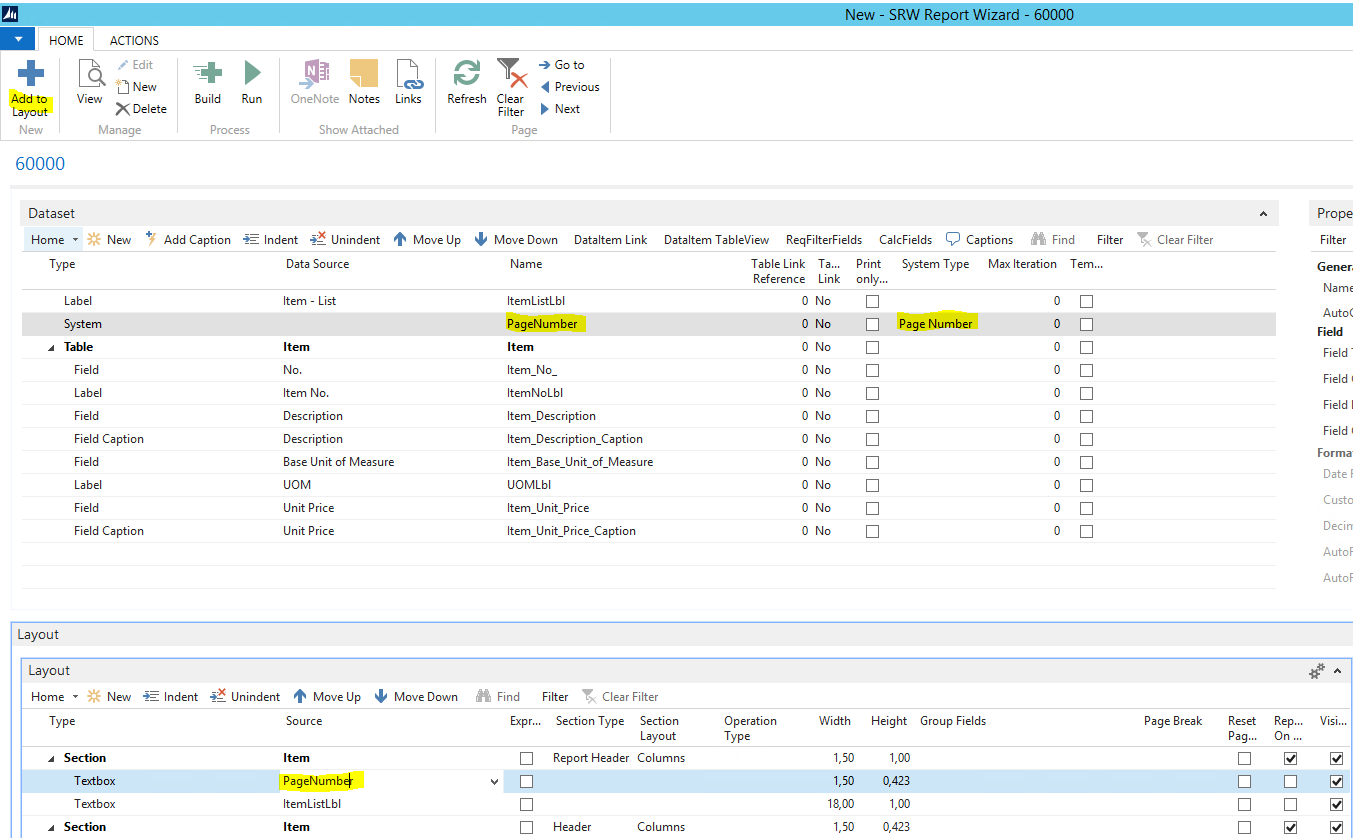
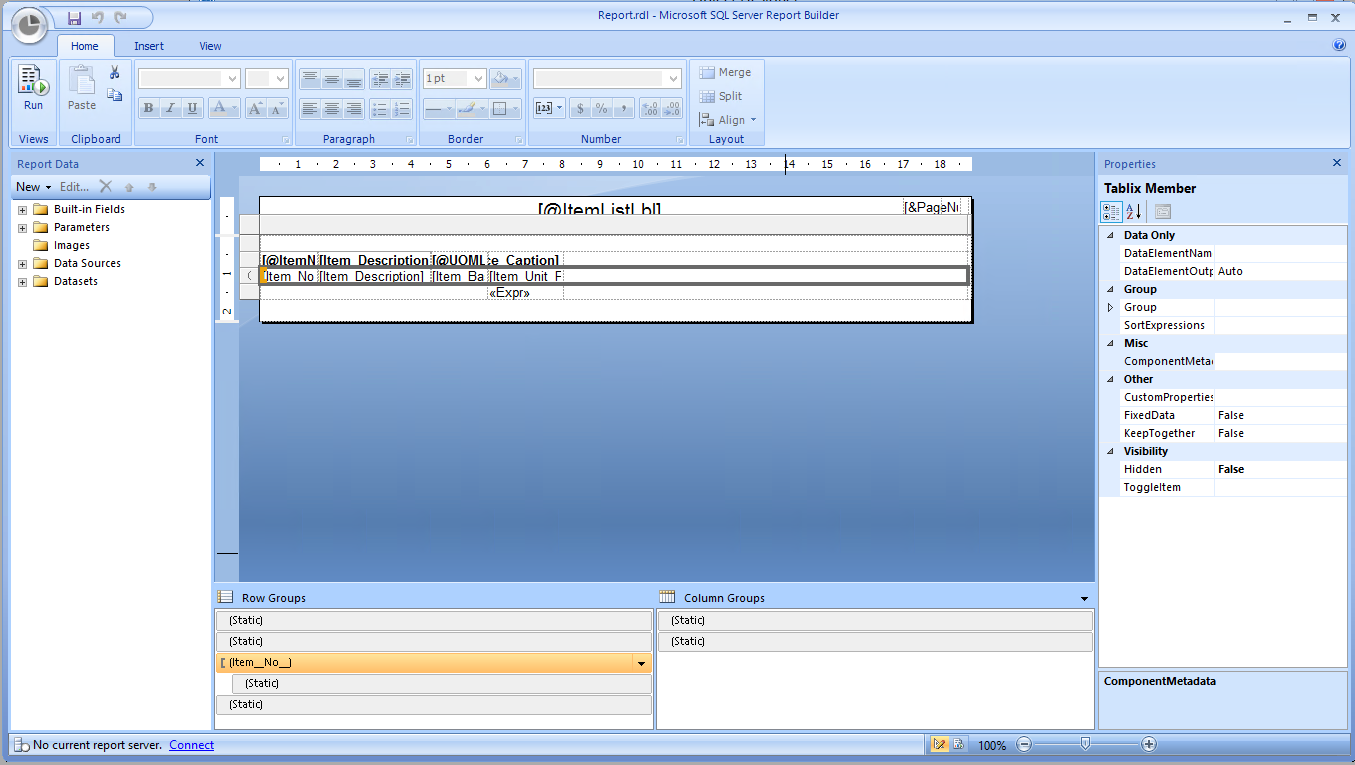
#22 The last adjustment we could do is to add the page number at the top right corner of the page. In order to do this, we need to go back to the report dataset designer, add a new line, set the Type to System, set the System Type to Page Number and give it a Name. Now we select the Report Header section in the layout and add page number there.
#23 To appear the changes where we want it, we need to give it a coordinate on the right, so we type 17 cm in the Left property. Since we have typed in the coordinate manually, it will no longer will follow the usual element flow from left to right and will have section-relative coordinates.
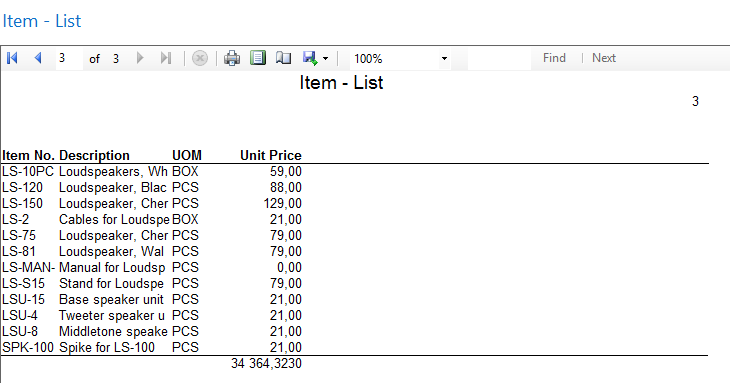
Report is built!
Take a look at the object, which has been generated for it.
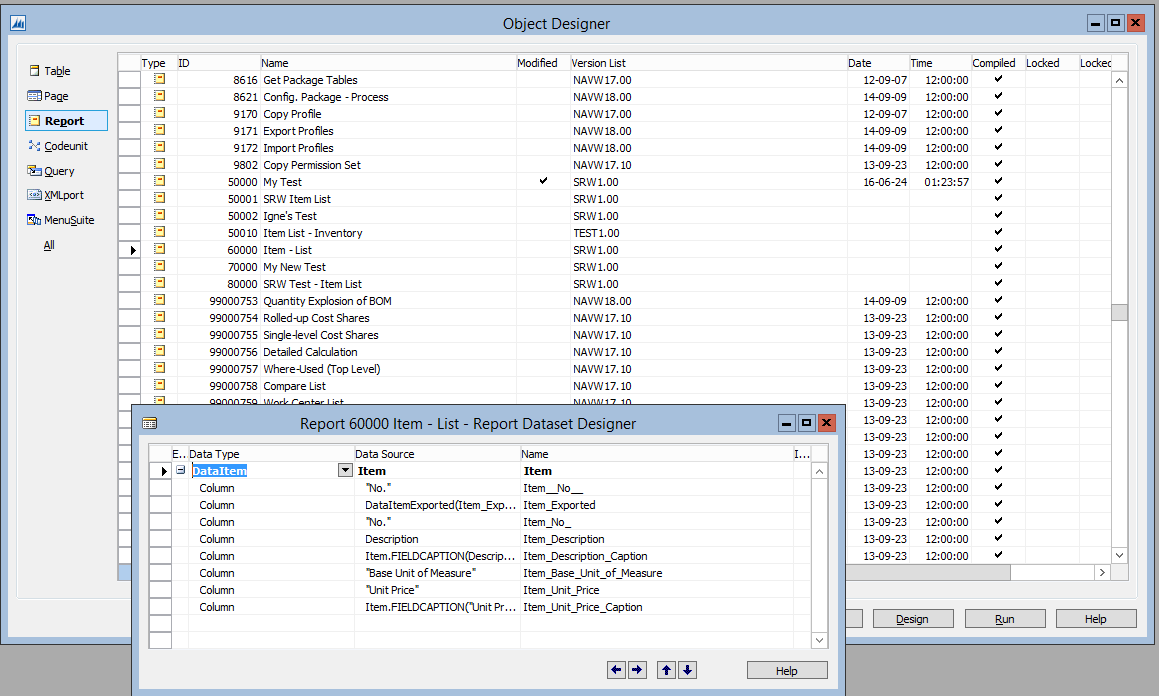
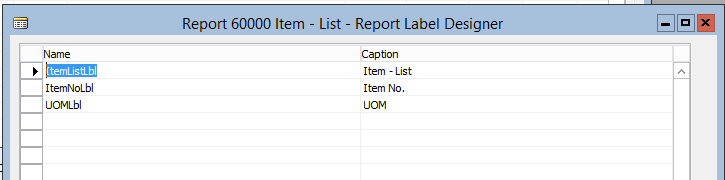
It’s a regular report with a dataset, which is very similar to the one we’ve built using Simplanova Report Wizard. We can also see the labels there.
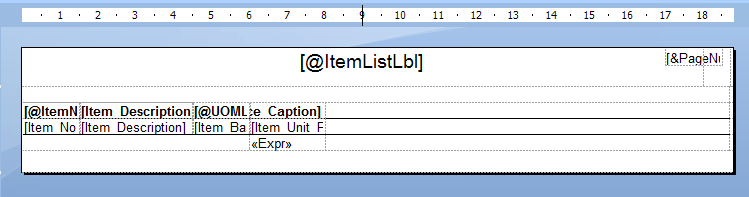
There’s also the RDLC layout we could expect. It includes all the fields we would expect and there’s tablix-based data grouping.
Simplanova Report Wizard lets build reports much quicker and more convenient than building reports using the regular RTC report designer. We think that the usability might even be better than what Classic report designer had to offer with the ability to build an easy grid flow, following the page designer logic. You can read more about How Microsoft Dynamics NAV report tools have evolved during the years.
Would like to be one of the first to test Simplanova Report Wizard and help us improve it by providing your feedback? Please contact us [email protected]